
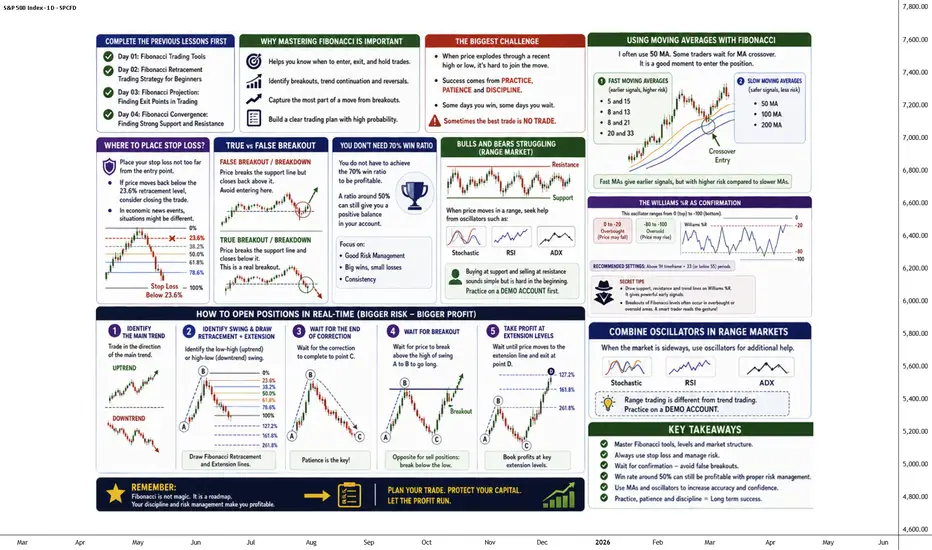
Advanced Fibonacci Strategies for Smarter Trading Decisions
****************************
Before reading this article, make sure you complete the previous parts of this Fibonacci trading course:
Day 01: Fibonacci Trading Tools
Day 02: Fibonacci Retracement Trading Strategy for Beginners
Day 03: Fibonacci Projection: Finding Exit Points in Trading
Day 04: Fibonacci Convergence: Finding Strong Support and Resistance
Today, we move from beginner-level concepts toward advanced Fibonacci trading techniques.
Why Is Fibonacci Important?
****************************
Most ordinary traders are confused about:
Many traders simply follow the market without a clear plan.
A skilled Fibonacci trader, however, can often capture a large part of a market move by understanding:
The Biggest Challenge of Fibonacci Trading
****************************
One disadvantage of Fibonacci trading appears when the market suddenly explodes above a recent high or below a recent low.
In such situations, it becomes difficult to join the move safely.
That is why the real keys to success are:
Some trading days will offer excellent opportunities.
On other days, the market may offer nothing at all.
And sometimes, the best trade is no trade.
Avoid blindly entering unknown trends just because the market is moving fast.
Where Should You Place Stop Loss?
****************************
Your stop loss should not be placed too far from the entry point.
However, during major economic news events, market volatility may behave differently.
Always adjust risk management according to market conditions.
How to Identify False Breakouts
****************************
Sometimes the market breaks a support or resistance level but quickly reverses. This is called: False breakout OR False breakdown
This may indicate a fake breakdown.
A real breakout usually happens when: Price closes strongly beyond the support or resistance level.
That is why professional traders wait for confirmation before entering trades.
You Do Not Need a High Win Ratio
****************************
Many beginners believe they must win 70% or 80% of trades to become profitable. That is not true. Even a trading strategy with around a 50% win ratio can become profitable if:
How to Open Positions in Real-Time (Bigger Risk = Bigger Potential Reward)
****************************
Step 1: Identify the Main Trend (Bullish/Bearish)
Step 2: Identify the Swing (HighSwing=Up OR LowSwing=Down + Fibonacci Retracement and Extension levels)
Step 3: Wait for the Correction (Patience is the key: Wait for the correction to end at Point C.)
Step 4: Wait for the Breakout
Step 5: Exit at Fibonacci Extension Levels (127%, 161.8%, 261.8%...)
Using Moving Averages with Fibonacci
****************************
Moving averages work very well with Fibonacci tools. Personally, I often use the: 50 Moving Average + 200 Moving Average
Popular Fast Moving Average Combinations: 5 and 15, 8 and 13, 8 and 21, 20 and 33
Popular Slow Moving Average Combinations: 50 MA, 100 MA, 200 MA
Many traders also wait for moving average crossovers before entering trades.
Using Williams %R as Confirmation
The Williams %R oscillator can help confirm market conditions. The Williams %R moves between: 0 at the top | -100 at the bottom
Interpretation: Between 0 and -20 → Overbought | Between -80 and -100 → Oversold
It works similarly to the Stochastic Oscillator.
Bulls and Bears in Range Markets
****************************
When the market moves sideways inside a range, traders often use oscillators for additional help. Popular choices include:
Range trading is very different from trend trading. Buying at support and selling at resistance may sound simple, but it requires practice and emotional control. If you are learning range trading, practice first on a demo account.
The more experience you gain with Fibonacci retracement, extension, convergence, moving averages, and oscillators, the more naturally market structure will start making sense to you.
****************************
Before reading this article, make sure you complete the previous parts of this Fibonacci trading course:
Day 01: Fibonacci Trading Tools
Day 02: Fibonacci Retracement Trading Strategy for Beginners
Day 03: Fibonacci Projection: Finding Exit Points in Trading
Day 04: Fibonacci Convergence: Finding Strong Support and Resistance
Today, we move from beginner-level concepts toward advanced Fibonacci trading techniques.
Why Is Fibonacci Important?
****************************
Most ordinary traders are confused about:
- When to enter a trade
- When to exit a trade
- Whether a breakout is real or false
- Where to place stop loss
- How to manage profits properly
Many traders simply follow the market without a clear plan.
A skilled Fibonacci trader, however, can often capture a large part of a market move by understanding:
- Retracement levels
- Breakout zones
- Extensions
- Market structure
- Trend continuation
The Biggest Challenge of Fibonacci Trading
****************************
One disadvantage of Fibonacci trading appears when the market suddenly explodes above a recent high or below a recent low.
In such situations, it becomes difficult to join the move safely.
That is why the real keys to success are:
- Practice
- Patience
- Discipline
Some trading days will offer excellent opportunities.
On other days, the market may offer nothing at all.
And sometimes, the best trade is no trade.
Avoid blindly entering unknown trends just because the market is moving fast.
Where Should You Place Stop Loss?
****************************
Your stop loss should not be placed too far from the entry point.
For example:
If price moves back below the 23.6% retracement level after a breakout, many traders may close the trade.
However, during major economic news events, market volatility may behave differently.
Always adjust risk management according to market conditions.
How to Identify False Breakouts
****************************
Sometimes the market breaks a support or resistance level but quickly reverses. This is called: False breakout OR False breakdown
Example: Price breaks below support > Then closes back above support
This may indicate a fake breakdown.
A real breakout usually happens when: Price closes strongly beyond the support or resistance level.
That is why professional traders wait for confirmation before entering trades.
You Do Not Need a High Win Ratio
****************************
Many beginners believe they must win 70% or 80% of trades to become profitable. That is not true. Even a trading strategy with around a 50% win ratio can become profitable if:
- Risk management is strong
- Profits are larger than losses
- Discipline is maintained
Successful trading is not about winning every trade. It is about managing losses and maximizing good trades.
How to Open Positions in Real-Time (Bigger Risk = Bigger Potential Reward)
****************************
Step 1: Identify the Main Trend (Bullish/Bearish)
Step 2: Identify the Swing (HighSwing=Up OR LowSwing=Down + Fibonacci Retracement and Extension levels)
Step 3: Wait for the Correction (Patience is the key: Wait for the correction to end at Point C.)
Step 4: Wait for the Breakout
Step 5: Exit at Fibonacci Extension Levels (127%, 161.8%, 261.8%...)
Using Moving Averages with Fibonacci
****************************
Moving averages work very well with Fibonacci tools. Personally, I often use the: 50 Moving Average + 200 Moving Average
Popular Fast Moving Average Combinations: 5 and 15, 8 and 13, 8 and 21, 20 and 33
Popular Slow Moving Average Combinations: 50 MA, 100 MA, 200 MA
Many traders also wait for moving average crossovers before entering trades.
Using Williams %R as Confirmation
The Williams %R oscillator can help confirm market conditions. The Williams %R moves between: 0 at the top | -100 at the bottom
Interpretation: Between 0 and -20 → Overbought | Between -80 and -100 → Oversold
It works similarly to the Stochastic Oscillator.
Many traders do not know this that they can draw: Support lines, Resistance lines, Trend lines directly on oscillators like Williams %R.
This can help identify: Hidden breakouts, Momentum shifts, Early signals before price action becomes obvious.
Bulls and Bears in Range Markets
****************************
When the market moves sideways inside a range, traders often use oscillators for additional help. Popular choices include:
- RSI
- Stochastic
- ADX
Range trading is very different from trend trading. Buying at support and selling at resistance may sound simple, but it requires practice and emotional control. If you are learning range trading, practice first on a demo account.
Remember: The goal is not to predict every move perfectly.
Goal should be Improve probabilities, Control risk, Build discipline, and Trade with a structured plan
The more experience you gain with Fibonacci retracement, extension, convergence, moving averages, and oscillators, the more naturally market structure will start making sense to you.

Haftungsausschluss
Die Informationen und Veröffentlichungen sind nicht als Finanz-, Anlage-, Handels- oder andere Arten von Ratschlägen oder Empfehlungen gedacht, die von TradingView bereitgestellt oder gebilligt werden, und stellen diese nicht dar. Lesen Sie mehr in den Nutzungsbedingungen.
Haftungsausschluss
Die Informationen und Veröffentlichungen sind nicht als Finanz-, Anlage-, Handels- oder andere Arten von Ratschlägen oder Empfehlungen gedacht, die von TradingView bereitgestellt oder gebilligt werden, und stellen diese nicht dar. Lesen Sie mehr in den Nutzungsbedingungen.