
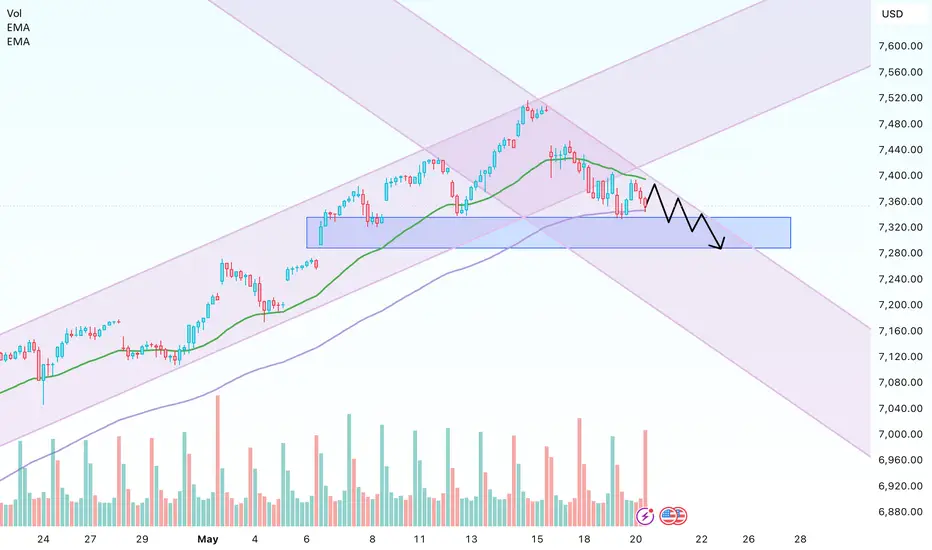
The S&P 500 is showing signs of consolidation on the H1 chart after weeks of strong upside momentum.
Instead of strong breakouts like earlier this month, the market is now moving sideways with repeated pullbacks around EMA34 and EMA89. The index is currently trading near 7,350 points — an important support area aligned with EMA89.
If buyers continue defending this zone, the market could still rebound toward the 7,500-point highs.
However, bullish momentum is clearly weakening. Recent rebounds lack strong volume and are quickly sold near EMA34, which often signals a cooling phase after a major rally.
Still, the fact that price remains above EMA89 and panic selling has not appeared yet suggests institutional money has not fully left equities.
Instead of strong breakouts like earlier this month, the market is now moving sideways with repeated pullbacks around EMA34 and EMA89. The index is currently trading near 7,350 points — an important support area aligned with EMA89.
If buyers continue defending this zone, the market could still rebound toward the 7,500-point highs.
However, bullish momentum is clearly weakening. Recent rebounds lack strong volume and are quickly sold near EMA34, which often signals a cooling phase after a major rally.
Still, the fact that price remains above EMA89 and panic selling has not appeared yet suggests institutional money has not fully left equities.

Verbundene Veröffentlichungen
Haftungsausschluss
Die Informationen und Veröffentlichungen sind nicht als Finanz-, Anlage-, Handels- oder andere Arten von Ratschlägen oder Empfehlungen gedacht, die von TradingView bereitgestellt oder gebilligt werden, und stellen diese nicht dar. Lesen Sie mehr in den Nutzungsbedingungen.
Verbundene Veröffentlichungen
Haftungsausschluss
Die Informationen und Veröffentlichungen sind nicht als Finanz-, Anlage-, Handels- oder andere Arten von Ratschlägen oder Empfehlungen gedacht, die von TradingView bereitgestellt oder gebilligt werden, und stellen diese nicht dar. Lesen Sie mehr in den Nutzungsbedingungen.