
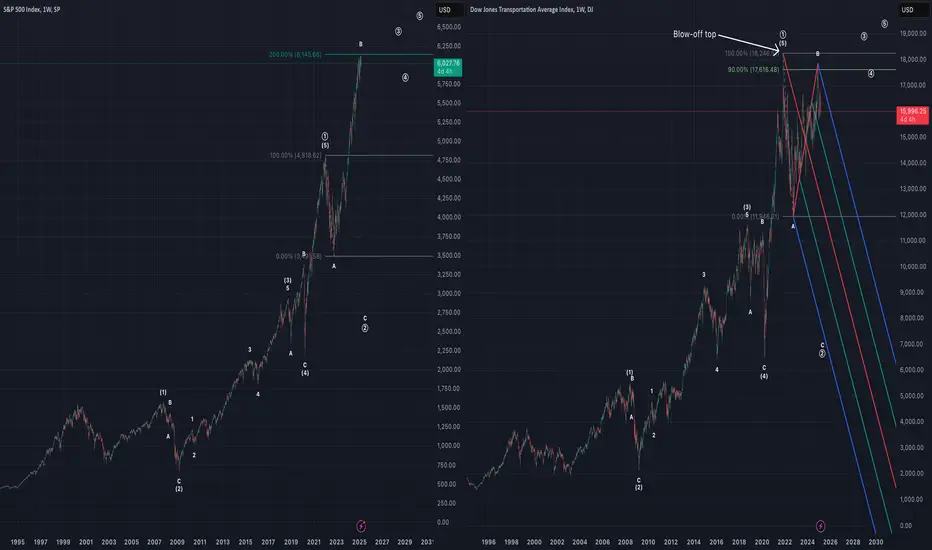
Chart comparing SPX and DJT.
This count has SPX and DJT in wave ((2)) of ((5)), with wave ((2)) of SPX as an expanded flat and wave ((2)) of DJT as a regular flat.
For SPX, wave B of the expanded flat ends up being 200% of wave A (nearly to the tic). For DJT, wave B of the regular flat ends up being ~90% of wave A.
If correct, would expect wave C to target March 2020 lows.
This count has SPX and DJT in wave ((2)) of ((5)), with wave ((2)) of SPX as an expanded flat and wave ((2)) of DJT as a regular flat.
For SPX, wave B of the expanded flat ends up being 200% of wave A (nearly to the tic). For DJT, wave B of the regular flat ends up being ~90% of wave A.
If correct, would expect wave C to target March 2020 lows.

Haftungsausschluss
Die Informationen und Veröffentlichungen sind nicht als Finanz-, Anlage-, Handels- oder andere Arten von Ratschlägen oder Empfehlungen gedacht, die von TradingView bereitgestellt oder gebilligt werden, und stellen diese nicht dar. Lesen Sie mehr in den Nutzungsbedingungen.
Haftungsausschluss
Die Informationen und Veröffentlichungen sind nicht als Finanz-, Anlage-, Handels- oder andere Arten von Ratschlägen oder Empfehlungen gedacht, die von TradingView bereitgestellt oder gebilligt werden, und stellen diese nicht dar. Lesen Sie mehr in den Nutzungsbedingungen.