
Bull market to continue to 2029-30
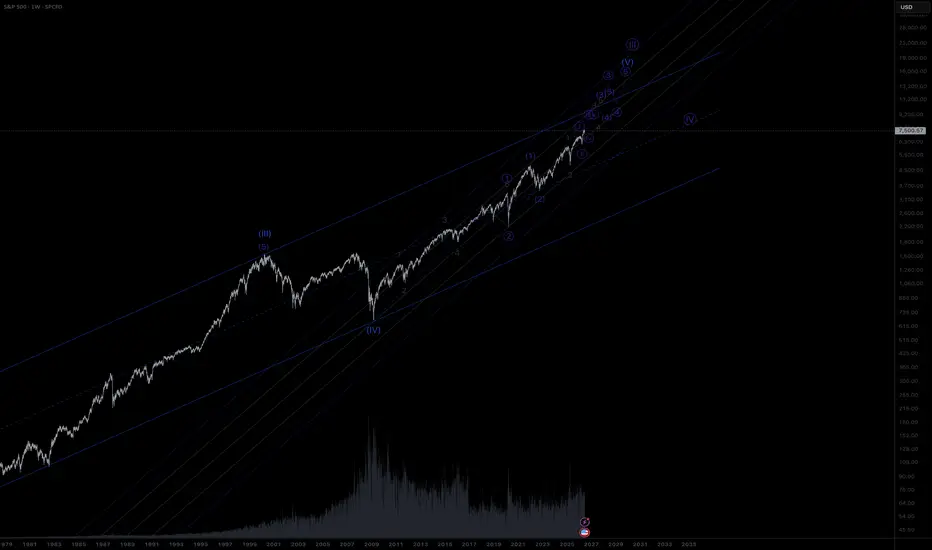
As per the last published idea here is the SPX weekly chart with a suggested Elliot Wave count to take us up till 2029-30. After this the correction will either be a Wave IV or a large Wave 1-2 which could be more of a depression in the 2030's.
As per the last published idea here is the SPX weekly chart with a suggested Elliot Wave count to take us up till 2029-30. After this the correction will either be a Wave IV or a large Wave 1-2 which could be more of a depression in the 2030's.

Haftungsausschluss
Die Informationen und Veröffentlichungen sind nicht als Finanz-, Anlage-, Handels- oder andere Arten von Ratschlägen oder Empfehlungen gedacht, die von TradingView bereitgestellt oder gebilligt werden, und stellen diese nicht dar. Lesen Sie mehr in den Nutzungsbedingungen.
Haftungsausschluss
Die Informationen und Veröffentlichungen sind nicht als Finanz-, Anlage-, Handels- oder andere Arten von Ratschlägen oder Empfehlungen gedacht, die von TradingView bereitgestellt oder gebilligt werden, und stellen diese nicht dar. Lesen Sie mehr in den Nutzungsbedingungen.