
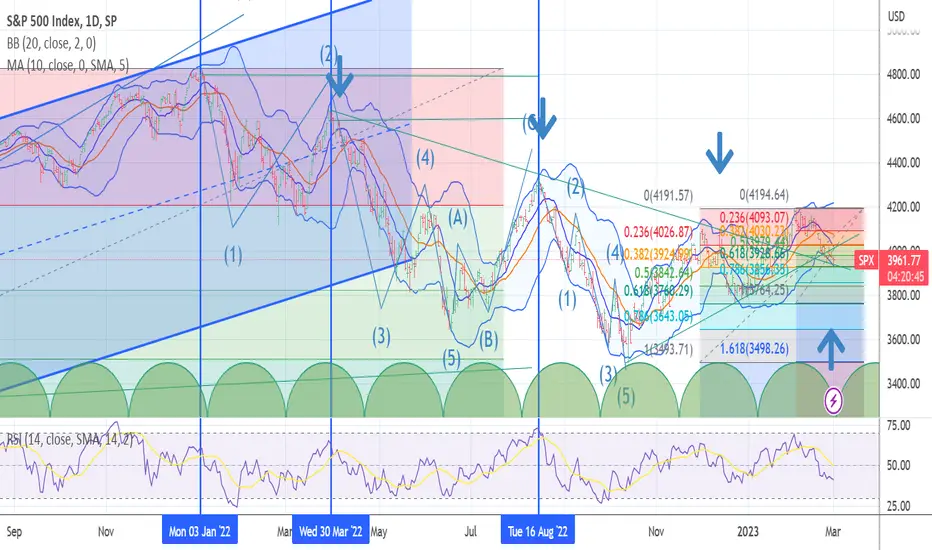
The chart posted is now retested the breakout trendline as well as the bb bands and 200 day moving avg into cycle low . the only thing we did not see a jump in VIX but a break down showing me that we are moving into a last level of support before the next bear market phase the panic is not until june to oct .am net long 95 % qqq 289/291 filled 290 .40 and spx the other day 3944 . I will remain bullish now till we reach the upside target 4222/4308 . best of trades WAVETIMER

Haftungsausschluss
Die Informationen und Veröffentlichungen sind nicht als Finanz-, Anlage-, Handels- oder andere Arten von Ratschlägen oder Empfehlungen gedacht, die von TradingView bereitgestellt oder gebilligt werden, und stellen diese nicht dar. Lesen Sie mehr in den Nutzungsbedingungen.
Haftungsausschluss
Die Informationen und Veröffentlichungen sind nicht als Finanz-, Anlage-, Handels- oder andere Arten von Ratschlägen oder Empfehlungen gedacht, die von TradingView bereitgestellt oder gebilligt werden, und stellen diese nicht dar. Lesen Sie mehr in den Nutzungsbedingungen.