
Technical Analysis and Outlook:
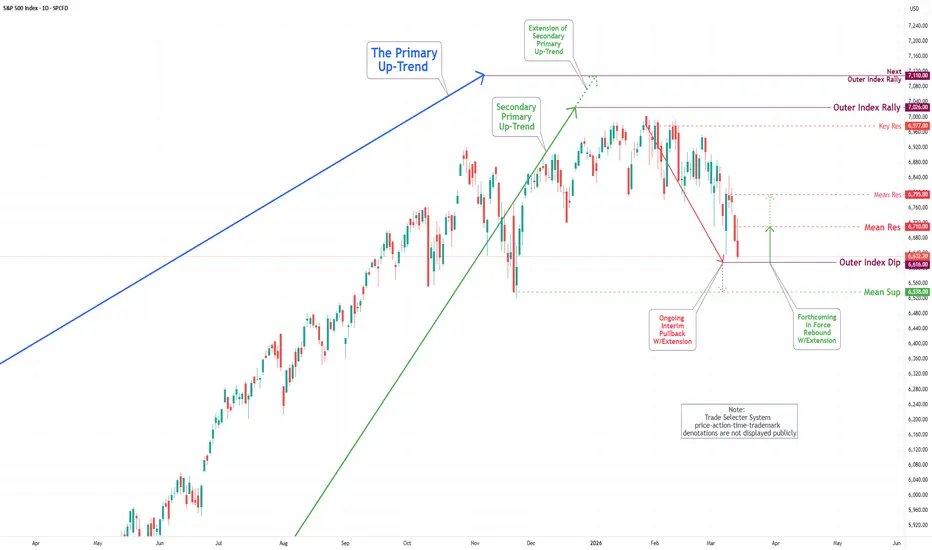
The S&P 500 Index experienced a significant decline this week, dropping from the Mean Resistance level of 6,829. It fell below the Mean Support level of 6,722 and is currently positioned just above the Outer Index Dip at 6,616.
In the upcoming trading session, the S&P 500 Index is projected to reach and complete the Outer Index Dip at 6,616, suggesting a strong likelihood of a notable rebound that could lead to steady-to-higher movement toward the Mean Resistance level of 6,710 and reaching out the Mean Resistance level of 6,795; however, if this market scenario is not met, the index may continue present decline towards the Mean Resistance level of 6,538.
The S&P 500 Index experienced a significant decline this week, dropping from the Mean Resistance level of 6,829. It fell below the Mean Support level of 6,722 and is currently positioned just above the Outer Index Dip at 6,616.
In the upcoming trading session, the S&P 500 Index is projected to reach and complete the Outer Index Dip at 6,616, suggesting a strong likelihood of a notable rebound that could lead to steady-to-higher movement toward the Mean Resistance level of 6,710 and reaching out the Mean Resistance level of 6,795; however, if this market scenario is not met, the index may continue present decline towards the Mean Resistance level of 6,538.

Verbundene Veröffentlichungen
Haftungsausschluss
Die Informationen und Veröffentlichungen sind nicht als Finanz-, Anlage-, Handels- oder andere Arten von Ratschlägen oder Empfehlungen gedacht, die von TradingView bereitgestellt oder gebilligt werden, und stellen diese nicht dar. Lesen Sie mehr in den Nutzungsbedingungen.
Verbundene Veröffentlichungen
Haftungsausschluss
Die Informationen und Veröffentlichungen sind nicht als Finanz-, Anlage-, Handels- oder andere Arten von Ratschlägen oder Empfehlungen gedacht, die von TradingView bereitgestellt oder gebilligt werden, und stellen diese nicht dar. Lesen Sie mehr in den Nutzungsbedingungen.