
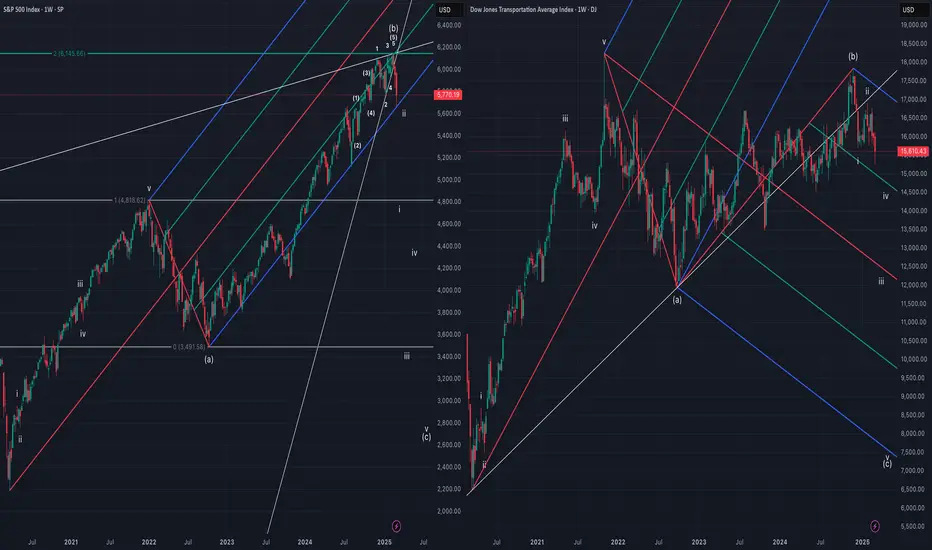
Chart comparing SPX and DJT.
SPX drawn with expanded flat, (b) is 200% of (a) and completes with ending diagonal wedge.
DJT drawn with regular flat, (b) ~90% of (a), wave (c) began in November of 2024 and currently in wave iii of (c).
Bears looking for SPX pitchfork support to break and become resistance, both SPX and DJT looking to eventually break October 2022 low and approach March 2020 lows to complete their corrective structures.

Haftungsausschluss
Die Informationen und Veröffentlichungen sind nicht als Finanz-, Anlage-, Handels- oder andere Arten von Ratschlägen oder Empfehlungen gedacht, die von TradingView bereitgestellt oder gebilligt werden, und stellen diese nicht dar. Lesen Sie mehr in den Nutzungsbedingungen.
Haftungsausschluss
Die Informationen und Veröffentlichungen sind nicht als Finanz-, Anlage-, Handels- oder andere Arten von Ratschlägen oder Empfehlungen gedacht, die von TradingView bereitgestellt oder gebilligt werden, und stellen diese nicht dar. Lesen Sie mehr in den Nutzungsbedingungen.