
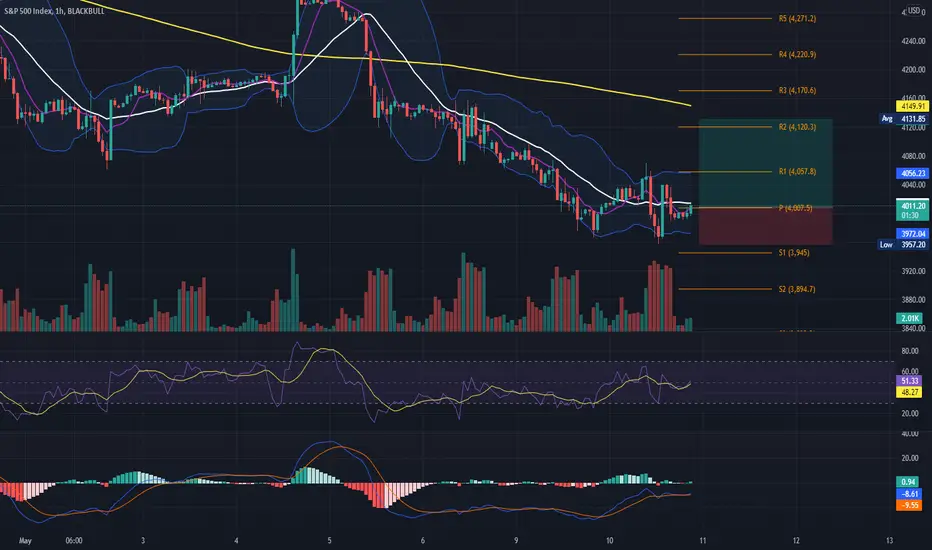
Hey traders, SPX is showing the last correction wave C 1-day frame, which is almost over. The market is bearish, we will see the market going slowly higher, bouncing between the pivot point bands and going up.
Pls remember to check the trend, the price should stay up at the pivot point level and bounce in it, without breaking. If the price goes down the pivot point and then S1, we will switch into a downtrend again.
Pls , see the pivot point levels in the chart.(R1,R2) The market has the last word.
Indicators, MA 200, 20-8 RSI 8 MA8 Bollinger 20, Volume , Pivot points Levels. Intraday Strategy. MACD

Haftungsausschluss
Die Informationen und Veröffentlichungen sind nicht als Finanz-, Anlage-, Handels- oder andere Arten von Ratschlägen oder Empfehlungen gedacht, die von TradingView bereitgestellt oder gebilligt werden, und stellen diese nicht dar. Lesen Sie mehr in den Nutzungsbedingungen.
Haftungsausschluss
Die Informationen und Veröffentlichungen sind nicht als Finanz-, Anlage-, Handels- oder andere Arten von Ratschlägen oder Empfehlungen gedacht, die von TradingView bereitgestellt oder gebilligt werden, und stellen diese nicht dar. Lesen Sie mehr in den Nutzungsbedingungen.