
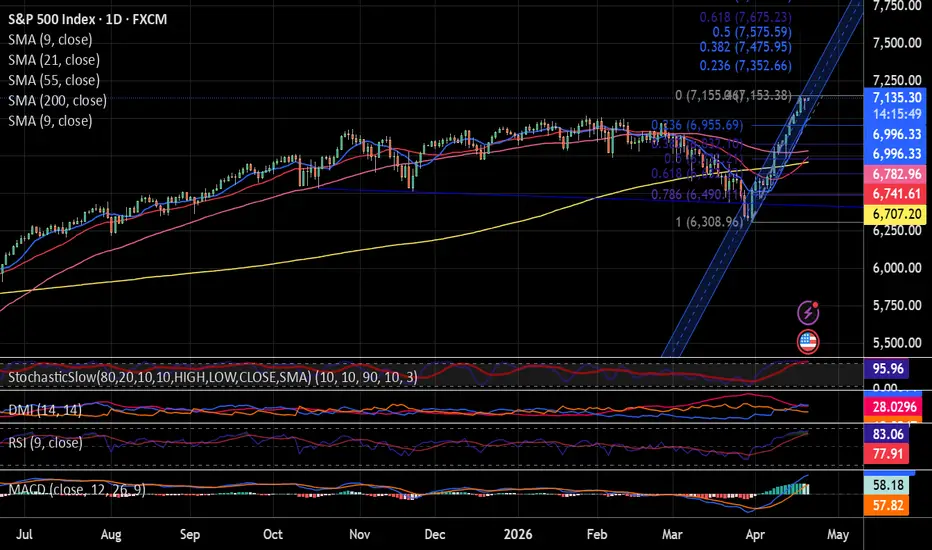
S&P 500 Beginning to Look Overbought…
The S&P is currently sitting in extreme overbought territory (95–96%), while the MACD continues to trend higher. This combination typically signals a short-term pullback within a broader bullish structure.#Traders
📊 Key Takeaways & Strategy
• We remain in a buy-the-dips environment following the break of the rounding top formation
• However, multi-timeframe overbought conditions (Weekly & Monthly) suggest a classic exhaustion phase is approaching #marketpsychology
📍 Support Zones to Watch
7026 – 6996 → Primary dip-buying region
6955 → Deeper support if momentum fades
6782 / 6741 → Cluster of moving averages
6707 → Critical 200-day moving average
📍 Resistance & Upside Levels
Daily Pivot: 7131 (current trading level)
R1: 7177
R2: 7206
R3: 7232
Trend Channel Top: 7280
Fib Extension (23.6%): 7352 #Fibonacci
📈 Outlook
As we push into uncharted territory, Pivot Points and Fibonacci extensions become key for identifying resistance.
A controlled pullback over the coming sessions would be constructive before any sustained move higher. #retailtrading
Holding above the Daily Pivot (7131) keeps the bullish structure intact. A failure below opens the door for a deeper retracement toward key support levels.
👀 All eyes now shift to the US session, where volatility is likely to pick up and define the next move.#proptrading
This remains a tactical market — disciplined positioning is key.
⚠️ This is not investment advice.
My Money. My Risk. #tradingstrategy #S&P500 #MarketOutlook #IndexTrading
The S&P is currently sitting in extreme overbought territory (95–96%), while the MACD continues to trend higher. This combination typically signals a short-term pullback within a broader bullish structure.#Traders
📊 Key Takeaways & Strategy
• We remain in a buy-the-dips environment following the break of the rounding top formation
• However, multi-timeframe overbought conditions (Weekly & Monthly) suggest a classic exhaustion phase is approaching #marketpsychology
📍 Support Zones to Watch
7026 – 6996 → Primary dip-buying region
6955 → Deeper support if momentum fades
6782 / 6741 → Cluster of moving averages
6707 → Critical 200-day moving average
📍 Resistance & Upside Levels
Daily Pivot: 7131 (current trading level)
R1: 7177
R2: 7206
R3: 7232
Trend Channel Top: 7280
Fib Extension (23.6%): 7352 #Fibonacci
📈 Outlook
As we push into uncharted territory, Pivot Points and Fibonacci extensions become key for identifying resistance.
A controlled pullback over the coming sessions would be constructive before any sustained move higher. #retailtrading
Holding above the Daily Pivot (7131) keeps the bullish structure intact. A failure below opens the door for a deeper retracement toward key support levels.
👀 All eyes now shift to the US session, where volatility is likely to pick up and define the next move.#proptrading
This remains a tactical market — disciplined positioning is key.
⚠️ This is not investment advice.
My Money. My Risk. #tradingstrategy #S&P500 #MarketOutlook #IndexTrading

Haftungsausschluss
Die Informationen und Veröffentlichungen sind nicht als Finanz-, Anlage-, Handels- oder andere Arten von Ratschlägen oder Empfehlungen gedacht, die von TradingView bereitgestellt oder gebilligt werden, und stellen diese nicht dar. Lesen Sie mehr in den Nutzungsbedingungen.
Haftungsausschluss
Die Informationen und Veröffentlichungen sind nicht als Finanz-, Anlage-, Handels- oder andere Arten von Ratschlägen oder Empfehlungen gedacht, die von TradingView bereitgestellt oder gebilligt werden, und stellen diese nicht dar. Lesen Sie mehr in den Nutzungsbedingungen.