
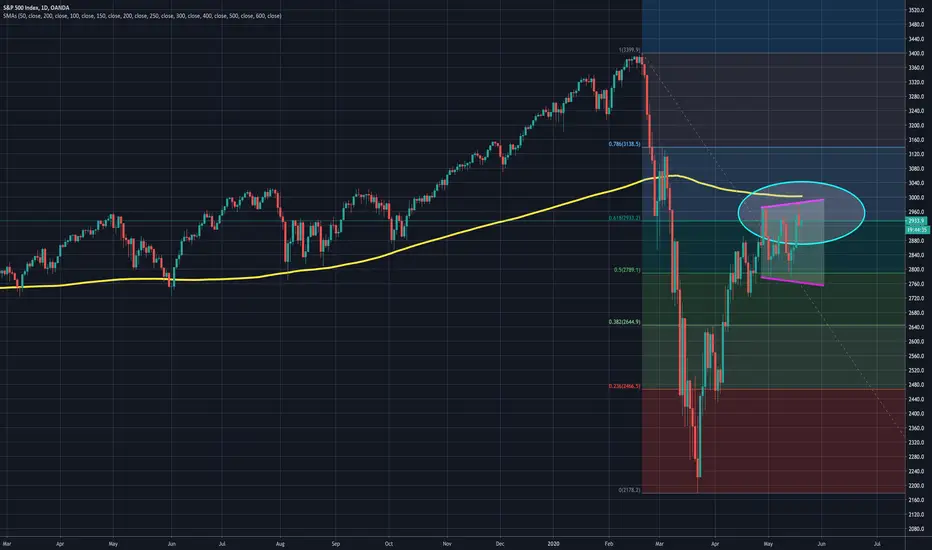
SP500 daily chart- Inside the eclipse, price is range bounding inside a broadening wedge, testing the 61.8% Fib Retracement level, and just under the all important flat 200-day Moving Average.
SP500 must over come all these obstacles to demonstrate a clear path to recovery.
SP500 must over come all these obstacles to demonstrate a clear path to recovery.

Haftungsausschluss
Die Informationen und Veröffentlichungen sind nicht als Finanz-, Anlage-, Handels- oder andere Arten von Ratschlägen oder Empfehlungen gedacht, die von TradingView bereitgestellt oder gebilligt werden, und stellen diese nicht dar. Lesen Sie mehr in den Nutzungsbedingungen.
Haftungsausschluss
Die Informationen und Veröffentlichungen sind nicht als Finanz-, Anlage-, Handels- oder andere Arten von Ratschlägen oder Empfehlungen gedacht, die von TradingView bereitgestellt oder gebilligt werden, und stellen diese nicht dar. Lesen Sie mehr in den Nutzungsbedingungen.