
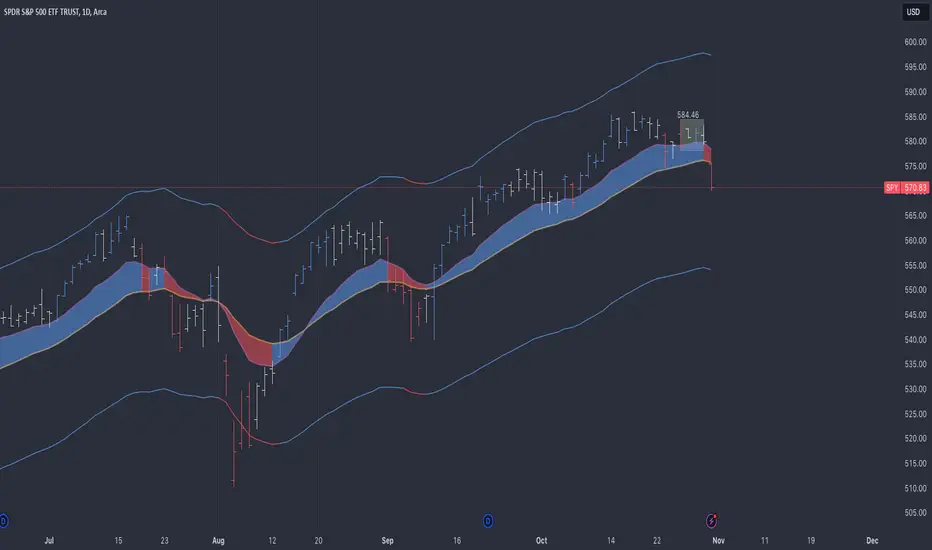
On the daily chart, there are three bearish signals without even considering indicators:
1. Price is below the EMAs.
2. With a gap down.
3. From a coil spring.
On the weekly chart, the trend remains intact. However, if we drop below the fast EMA, a significant test will be the slow EMA.

The key level to watch is the low of the daily channel line at $554, which aligns with the weekly slow EMA at approximately $551. For me, that represents the definitive line in the sand for SPY.
1. Price is below the EMAs.
2. With a gap down.
3. From a coil spring.
On the weekly chart, the trend remains intact. However, if we drop below the fast EMA, a significant test will be the slow EMA.
The key level to watch is the low of the daily channel line at $554, which aligns with the weekly slow EMA at approximately $551. For me, that represents the definitive line in the sand for SPY.

Haftungsausschluss
Die Informationen und Veröffentlichungen sind nicht als Finanz-, Anlage-, Handels- oder andere Arten von Ratschlägen oder Empfehlungen gedacht, die von TradingView bereitgestellt oder gebilligt werden, und stellen diese nicht dar. Lesen Sie mehr in den Nutzungsbedingungen.
Haftungsausschluss
Die Informationen und Veröffentlichungen sind nicht als Finanz-, Anlage-, Handels- oder andere Arten von Ratschlägen oder Empfehlungen gedacht, die von TradingView bereitgestellt oder gebilligt werden, und stellen diese nicht dar. Lesen Sie mehr in den Nutzungsbedingungen.