Hello, traders! 👋 Welcome to another technical analysis. Today, we're taking a closer look at SPY.

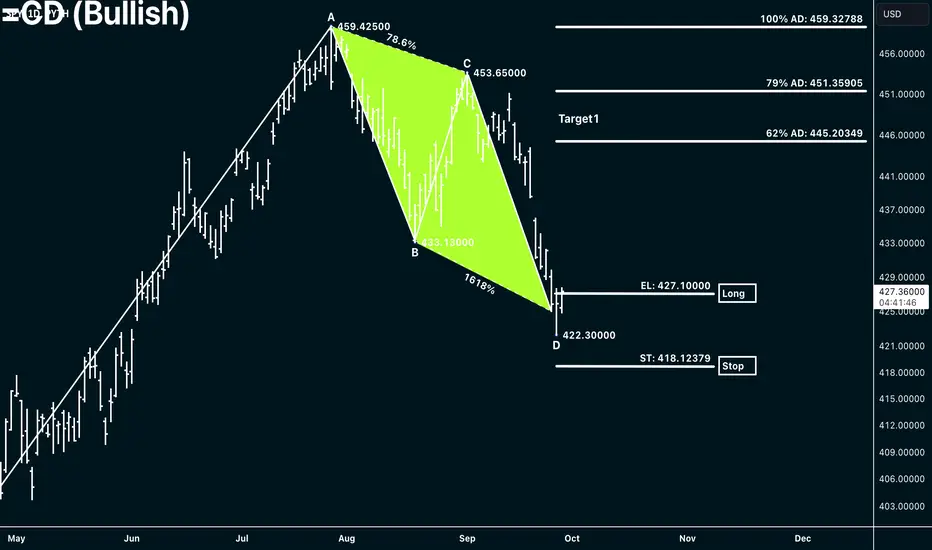
The chart illustrates a symmetry AB=CD pattern, which appears to be bullish on its daily chart. The price has reached an important support level at "D" 422.30000.
The strategy is straightforward: we will buy above the entry level (EL) at 427.10000 with a confirmed upward trend. Our stop-loss will be placed below the cluster zones at ST: 418.12379.
Our target levels will be as follows:
First target at 62% of AD: 445.20349- 79% of AD: 451.35905
Second target at 127% of AD: 469.70833-162% of AD: 482.52695
If you find this analysis interesting and useful, please show your support by liking and following. Stay tuned for more analyses like this one!
The chart illustrates a symmetry AB=CD pattern, which appears to be bullish on its daily chart. The price has reached an important support level at "D" 422.30000.
The strategy is straightforward: we will buy above the entry level (EL) at 427.10000 with a confirmed upward trend. Our stop-loss will be placed below the cluster zones at ST: 418.12379.
Our target levels will be as follows:
First target at 62% of AD: 445.20349- 79% of AD: 451.35905
Second target at 127% of AD: 469.70833-162% of AD: 482.52695
If you find this analysis interesting and useful, please show your support by liking and following. Stay tuned for more analyses like this one!
Anmerkung

Haftungsausschluss
Die Informationen und Veröffentlichungen sind nicht als Finanz-, Anlage-, Handels- oder andere Arten von Ratschlägen oder Empfehlungen gedacht, die von TradingView bereitgestellt oder gebilligt werden, und stellen diese nicht dar. Lesen Sie mehr in den Nutzungsbedingungen.
Haftungsausschluss
Die Informationen und Veröffentlichungen sind nicht als Finanz-, Anlage-, Handels- oder andere Arten von Ratschlägen oder Empfehlungen gedacht, die von TradingView bereitgestellt oder gebilligt werden, und stellen diese nicht dar. Lesen Sie mehr in den Nutzungsbedingungen.