
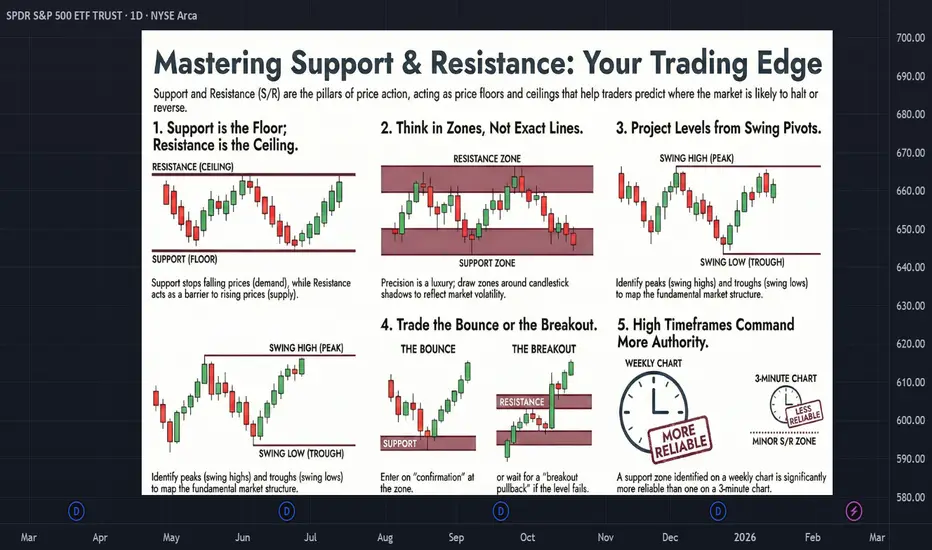
🔥MASTERING SUPPORT AND RESISTANCE: TRADING THE EDGE, NOT THE LINE🔥
Every trader has drawn the “perfect” horizontal line, only to watch price cut through it before reversing.
The issue is rarely the S/R level itself.
It is the expectation behind it.
📌 EDGE, NOT GUARANTEE
Support and resistance are not barriers. They are areas where the probability of market reaction increases.
They do not predict direction. But they are still helpful as they highlight locations where order flow imbalance is more likely than at any random price.
If markets were permanently random, edges would not persist. In a sense, these zones represent areas where participants previously agreed on value.
Thinking in probabilities is the key:
Each touch simply expresses more information for our analysis.
🧭 TRADE ZONES, NOT LINES
Precision is appealing but misleading.
Markets do not turn on precisely at a S/R level. Hence, it's more practical to see S/R as areas of prior imbalance.
Using thin horizontal lines often results in:
Instead, try defining price zones. One way is to use the wicks of the candlesticks to do so.
The chart below shows how we can draw support zones by combining the lower wicks of candlesticks at previous swing lows.

Wicks reflect rejection and participation extremes, revealing where aggressive buyers or sellers previously stepped in.
🎯 THE TESTING PARADOX
A common belief is that the more a level is tested, the stronger it becomes.
Structurally, the opposite tends to occur.
Each time support holds, buy orders are filled. Each bounce reduces the pool of remaining participants willing to defend that area.
The same applies to resistance and sellers.
This creates a paradox:
Early tests often carry the highest energy.
Later tests may look convincing on a chart, but liquidity at that price level is might be running thin.
When evaluating a zone, always ask:
Is this level still defended, or has it already been consumed?
🔄 THE ROLE REVERSAL PRINCIPLE
Market structure is dynamic.
When support breaks decisively, it often becomes resistance. When resistance breaks, it may convert into support.
This flip reflects trapped positioning and shifting order flow.
A decisive break typically includes:
Repeated support failures signal distribution and potential bearish continuation. Repeated resistance failures signal accumulation and potential bullish continuation.
Hence, be careful when interpreting minor breaches.
🧠 AVOID THE SPAGHETTI CHART
Hindsight is deceptive.
On historical charts, almost any line can appear meaningful. The human brain is wired to detect patterns even where none exist.
And by adding too many S/R lines, we get cluttered charts that reduce decision quality.
Maintain a disciplined framework:
Simplicity improves execution.
If every chart contains twenty levels, none of them carry weight.
⚙️ A REPEATABLE PROCESS</b]
Apply support and resistance with structure:
This process shifts focus from prediction to evaluation.
📊 FINAL TAKEAWAY
Support and resistance are not about drawing perfect lines.
They are about understanding where participation previously concentrated and whether that concentration still exists.
Remember:
Consistency in your process is more important then perfection in your results.
Trade the structure. Respect the probabilities.
Every trader has drawn the “perfect” horizontal line, only to watch price cut through it before reversing.
The issue is rarely the S/R level itself.
It is the expectation behind it.
📌 EDGE, NOT GUARANTEE
Support and resistance are not barriers. They are areas where the probability of market reaction increases.
They do not predict direction. But they are still helpful as they highlight locations where order flow imbalance is more likely than at any random price.
If markets were permanently random, edges would not persist. In a sense, these zones represent areas where participants previously agreed on value.
Support and resistance are price areas where a change in direction is more likely than random.
Thinking in probabilities is the key:
- A level that fails is not “wrong”
- A breakout is not manipulation
- A reaction is not confirmation of certainty
Each touch simply expresses more information for our analysis.
🧭 TRADE ZONES, NOT LINES
Precision is appealing but misleading.
Markets do not turn on precisely at a S/R level. Hence, it's more practical to see S/R as areas of prior imbalance.
Using thin horizontal lines often results in:
- Missed entries when price turns just before the line
- Premature stop-outs from shallow breaches
- Overconfidence in exact price levels
Instead, try defining price zones. One way is to use the wicks of the candlesticks to do so.
The chart below shows how we can draw support zones by combining the lower wicks of candlesticks at previous swing lows.
Wicks reflect rejection and participation extremes, revealing where aggressive buyers or sellers previously stepped in.
🎯 THE TESTING PARADOX
A common belief is that the more a level is tested, the stronger it becomes.
Structurally, the opposite tends to occur.
Each time support holds, buy orders are filled. Each bounce reduces the pool of remaining participants willing to defend that area.
The same applies to resistance and sellers.
This creates a paradox:
- More touches increase visibility (S/R becomes more established)
- More touches reduce potency (S/R becomes more likely to fail)
Early tests often carry the highest energy.
Later tests may look convincing on a chart, but liquidity at that price level is might be running thin.
When evaluating a zone, always ask:
Is this level still defended, or has it already been consumed?
🔄 THE ROLE REVERSAL PRINCIPLE
Market structure is dynamic.
When support breaks decisively, it often becomes resistance. When resistance breaks, it may convert into support.
This flip reflects trapped positioning and shifting order flow.
A decisive break typically includes:
- A strong close beyond the zone
- Failure to reclaim the area on immediate retest
- A swing structure forming beyond the prior boundary
- Acceptance above former resistance or below former support
Repeated support failures signal distribution and potential bearish continuation. Repeated resistance failures signal accumulation and potential bullish continuation.
Hence, be careful when interpreting minor breaches.
🧠 AVOID THE SPAGHETTI CHART
Hindsight is deceptive.
On historical charts, almost any line can appear meaningful. The human brain is wired to detect patterns even where none exist.
And by adding too many S/R lines, we get cluttered charts that reduce decision quality.
Maintain a disciplined framework:
- Define swings objectively using clear pivot criteria
- Keep only levels relevant to current price location
- Remove outdated zones outside your trading horizon
- Prioritize areas with structural confluence
- Avoid relying blindly on automated level indicators
Simplicity improves execution.
If every chart contains twenty levels, none of them carry weight.
⚙️ A REPEATABLE PROCESS</b]
Apply support and resistance with structure:
- Identify major swing highs and lows
- Mark zones using wick extremes, not single closes
- Assess number of prior tests and remaining potency
- Wait for decisive breaks before assuming role reversal
- Evaluate reaction quality — speed, rejection, follow-through
- Align decisions with broader market structure
This process shifts focus from prediction to evaluation.
📊 FINAL TAKEAWAY
Support and resistance are not about drawing perfect lines.
They are about understanding where participation previously concentrated and whether that concentration still exists.
Remember:
- Levels provide statistical advantage, not certainty
- Zones outperform precise lines
- Repeated testing weakens liquidity
- Breaks must show acceptance to confirm flips
- Simplicity protects objectivity
Consistency in your process is more important then perfection in your results.
Trade the structure. Respect the probabilities.

Price action | Founder of Trading Setups Review | tradingsetupsreview.com/ | Author of Day Trading With Price Action
Haftungsausschluss
Die Informationen und Veröffentlichungen sind nicht als Finanz-, Anlage-, Handels- oder andere Arten von Ratschlägen oder Empfehlungen gedacht, die von TradingView bereitgestellt oder gebilligt werden, und stellen diese nicht dar. Lesen Sie mehr in den Nutzungsbedingungen.
Price action | Founder of Trading Setups Review | tradingsetupsreview.com/ | Author of Day Trading With Price Action
Haftungsausschluss
Die Informationen und Veröffentlichungen sind nicht als Finanz-, Anlage-, Handels- oder andere Arten von Ratschlägen oder Empfehlungen gedacht, die von TradingView bereitgestellt oder gebilligt werden, und stellen diese nicht dar. Lesen Sie mehr in den Nutzungsbedingungen.