Greetings everyone,
(Key Takeaways) - (MONTHLY TIMEFRAME)
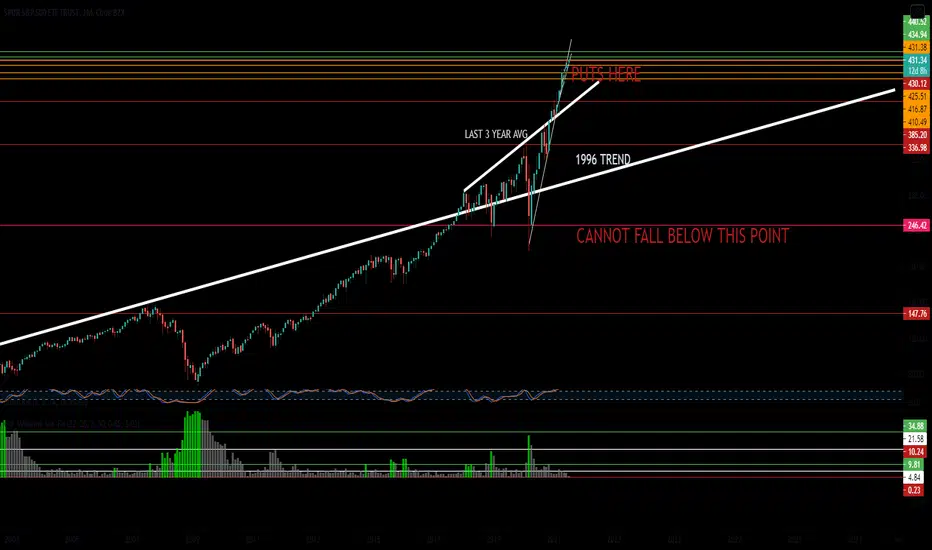
This SPY chart dating back to the date it was listed on the market back in 1993 gives us a wider point of view of the market.
Overall the sentiment is still bullish-long. However, the next couple of months can be bloodbaths.
Easy to say we are a bit over-extended? The smallest white trendline (2017-NOW) is showing signs of weakness.
Possible downward move towards $416.00 in the next couple of weeks.
The longer white trendline shows a possible 100 point loss down to $340.00.
Keep in mind we are entering earnings season so the risk is very high.
(My sentiment)
Bearish - Short term
Bullish - Long term
(Key Takeaways) - (MONTHLY TIMEFRAME)
This
SPY chart dating back to the date it was listed on the market back in 1993 gives us a wider point of view of the market.Overall the sentiment is still bullish-long. However, the next couple of months can be bloodbaths.
Easy to say we are a bit over-extended? The smallest white trendline (2017-NOW) is showing signs of weakness.
Possible downward move towards $416.00 in the next couple of weeks.
The longer white trendline shows a possible 100 point loss down to $340.00.
Keep in mind we are entering earnings season so the risk is very high.
(My sentiment)
Bearish - Short term
Bullish - Long term

Verbundene Veröffentlichungen
Haftungsausschluss
Die Informationen und Veröffentlichungen sind nicht als Finanz-, Anlage-, Handels- oder andere Arten von Ratschlägen oder Empfehlungen gedacht, die von TradingView bereitgestellt oder gebilligt werden, und stellen diese nicht dar. Lesen Sie mehr in den Nutzungsbedingungen.
Verbundene Veröffentlichungen
Haftungsausschluss
Die Informationen und Veröffentlichungen sind nicht als Finanz-, Anlage-, Handels- oder andere Arten von Ratschlägen oder Empfehlungen gedacht, die von TradingView bereitgestellt oder gebilligt werden, und stellen diese nicht dar. Lesen Sie mehr in den Nutzungsbedingungen.