
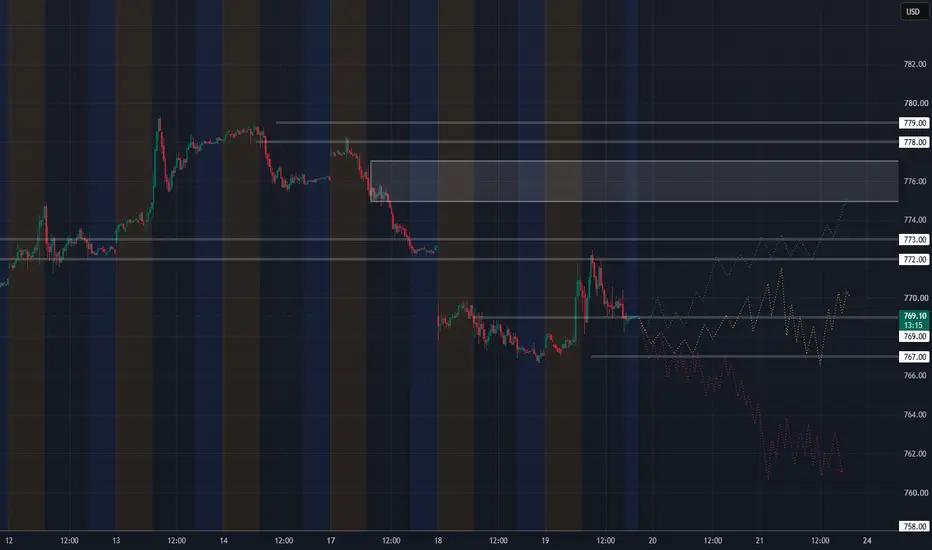
The Market Has Moved a Lot — But It Hasn’t Actually Gone Anywhere Yet
Structurally, SPY is still sitting in an important battlefield.
We’ve had a sharp selloff, a Treasury-driven rally, hawkish Fed minutes, major individual-stock moves, and continued sector rotation.
And after all of that, SPY is still sitting almost directly around the same 769 decision area.
That matters.
The market has received meaningful information this week and still has not established clear acceptance outside the current structure.
🟢 Green — genuine repair
For me this needs to happen sequentially.
769 holds → 772 reclaimed → 773 reclaimed → structure begins building above 773.
Only then do I start taking the larger recovery seriously.
Above 773, the next battlefield becomes:
775 → 776 → 778/779
Merely touching 772 or 773 is not enough.
We’ve already seen SPY reach that area.
Acceptance is what changes the chart.
If Thursday brings constructive economic data, yields remain contained, and SPY begins holding above 773, then Thursday and Friday could be spent repairing a meaningful portion of this week’s damage.
This is a real possibility, but it is not currently my favorite scenario.
🟡 Yellow — negotiation
Continued negotiation between roughly 767 and 773 remains very plausible.
Why?
Because buyers proved today that 767 is defendable.
But sellers also proved that 772–773 is not easily reclaimable.
That creates a natural battlefield.
We could see something like:
767/769 → 771/772 → rejection → 769 → another attempt
repeatedly while the market digests rates, Thursday’s data, Walmart earnings, and then Friday’s PMIs.
The important difference from earlier this week is that I would not expect this negotiation to remain neatly contained.
The structure is thinner and more fractured now.
So Yellow could mean larger probes, sharper reversals, and considerably more volatility while price still technically remains in negotiation.
And after what we’ve watched the last few sessions, I would not underestimate the market’s willingness to sit in this area and piss everybody off. 😂
Importantly, that would not necessarily represent bullish or bearish failure.
It could simply be price building new agreement after a violent move down from 779.
That could ultimately become constructive.
🔴 Red — bearish continuation
This becomes serious if:
769 fails → 767 fails → price cannot reclaim either one.
Again, the important word is:
Acceptance.
A wick through 767 is not enough.
We already learned how dangerous that assumption can be.
If SPY begins closing underneath 767 and subsequent attempts to reclaim the level fail, then the structure below gets considerably thinner.
The next major lower Active AOA reference on this chart is around:
758
I would not call 758 a target.
That is too simplistic.
What it tells us is that there is dramatically less established agreement underneath the current battlefield.
That means a genuine bearish expansion could become much more volatile and move faster than traders expect.
The red path may begin relatively orderly.
If acceptance develops below 767, the lack of structure underneath is what could make the move increasingly disorderly.
My weighting going into Thursday
🔴 Red — 45%
🟡 Yellow — 35%
🟢 Green — 20%
That is an interpretation of current structure and the macro environment, not a statistical forecast.
Red gets the edge because the hourly structure has become increasingly thin beneath the current battlefield, while the upside requires several layers of repair before the bullish case becomes convincing.
Yellow remains very plausible because SPY has demonstrated both:
buyers below
and
sellers above
Until one side actually wins, I see no reason to manufacture conviction.
The simple map
767 = structural floor / bearish trigger if accepted below
769 = current agreement / pivot
772–773 = first meaningful repair zone
775–776 = larger recovery confirmation
778–779 = old upper battlefield
758 = next major lower AOA if current structure truly fails
The asymmetry is worth noticing:
Above current price, structure is layered.
Below current price, structure gets sparse quickly.
That is why the bullish path may ultimately be more orderly, while a true bearish breakdown could become significantly more volatile.
I’m not interested in predicting which path SPY chooses.
I want to know what each path looks like before it happens.
I’m off from trading until Monday.
Sunday evening, we reset the board and map the next week.
Structurally, SPY is still sitting in an important battlefield.
We’ve had a sharp selloff, a Treasury-driven rally, hawkish Fed minutes, major individual-stock moves, and continued sector rotation.
And after all of that, SPY is still sitting almost directly around the same 769 decision area.
That matters.
The market has received meaningful information this week and still has not established clear acceptance outside the current structure.
🟢 Green — genuine repair
For me this needs to happen sequentially.
769 holds → 772 reclaimed → 773 reclaimed → structure begins building above 773.
Only then do I start taking the larger recovery seriously.
Above 773, the next battlefield becomes:
775 → 776 → 778/779
Merely touching 772 or 773 is not enough.
We’ve already seen SPY reach that area.
Acceptance is what changes the chart.
If Thursday brings constructive economic data, yields remain contained, and SPY begins holding above 773, then Thursday and Friday could be spent repairing a meaningful portion of this week’s damage.
This is a real possibility, but it is not currently my favorite scenario.
🟡 Yellow — negotiation
Continued negotiation between roughly 767 and 773 remains very plausible.
Why?
Because buyers proved today that 767 is defendable.
But sellers also proved that 772–773 is not easily reclaimable.
That creates a natural battlefield.
We could see something like:
767/769 → 771/772 → rejection → 769 → another attempt
repeatedly while the market digests rates, Thursday’s data, Walmart earnings, and then Friday’s PMIs.
The important difference from earlier this week is that I would not expect this negotiation to remain neatly contained.
The structure is thinner and more fractured now.
So Yellow could mean larger probes, sharper reversals, and considerably more volatility while price still technically remains in negotiation.
And after what we’ve watched the last few sessions, I would not underestimate the market’s willingness to sit in this area and piss everybody off. 😂
Importantly, that would not necessarily represent bullish or bearish failure.
It could simply be price building new agreement after a violent move down from 779.
That could ultimately become constructive.
🔴 Red — bearish continuation
This becomes serious if:
769 fails → 767 fails → price cannot reclaim either one.
Again, the important word is:
Acceptance.
A wick through 767 is not enough.
We already learned how dangerous that assumption can be.
If SPY begins closing underneath 767 and subsequent attempts to reclaim the level fail, then the structure below gets considerably thinner.
The next major lower Active AOA reference on this chart is around:
758
I would not call 758 a target.
That is too simplistic.
What it tells us is that there is dramatically less established agreement underneath the current battlefield.
That means a genuine bearish expansion could become much more volatile and move faster than traders expect.
The red path may begin relatively orderly.
If acceptance develops below 767, the lack of structure underneath is what could make the move increasingly disorderly.
My weighting going into Thursday
🔴 Red — 45%
🟡 Yellow — 35%
🟢 Green — 20%
That is an interpretation of current structure and the macro environment, not a statistical forecast.
Red gets the edge because the hourly structure has become increasingly thin beneath the current battlefield, while the upside requires several layers of repair before the bullish case becomes convincing.
Yellow remains very plausible because SPY has demonstrated both:
buyers below
and
sellers above
Until one side actually wins, I see no reason to manufacture conviction.
The simple map
767 = structural floor / bearish trigger if accepted below
769 = current agreement / pivot
772–773 = first meaningful repair zone
775–776 = larger recovery confirmation
778–779 = old upper battlefield
758 = next major lower AOA if current structure truly fails
The asymmetry is worth noticing:
Above current price, structure is layered.
Below current price, structure gets sparse quickly.
That is why the bullish path may ultimately be more orderly, while a true bearish breakdown could become significantly more volatile.
I’m not interested in predicting which path SPY chooses.
I want to know what each path looks like before it happens.
I’m off from trading until Monday.
Sunday evening, we reset the board and map the next week.

Verbundene Veröffentlichungen
Haftungsausschluss
Die Informationen und Veröffentlichungen sind nicht als Finanz-, Anlage-, Handels- oder andere Arten von Ratschlägen oder Empfehlungen gedacht, die von TradingView bereitgestellt oder gebilligt werden, und stellen diese nicht dar. Lesen Sie mehr in den Nutzungsbedingungen.
Verbundene Veröffentlichungen
Haftungsausschluss
Die Informationen und Veröffentlichungen sind nicht als Finanz-, Anlage-, Handels- oder andere Arten von Ratschlägen oder Empfehlungen gedacht, die von TradingView bereitgestellt oder gebilligt werden, und stellen diese nicht dar. Lesen Sie mehr in den Nutzungsbedingungen.