
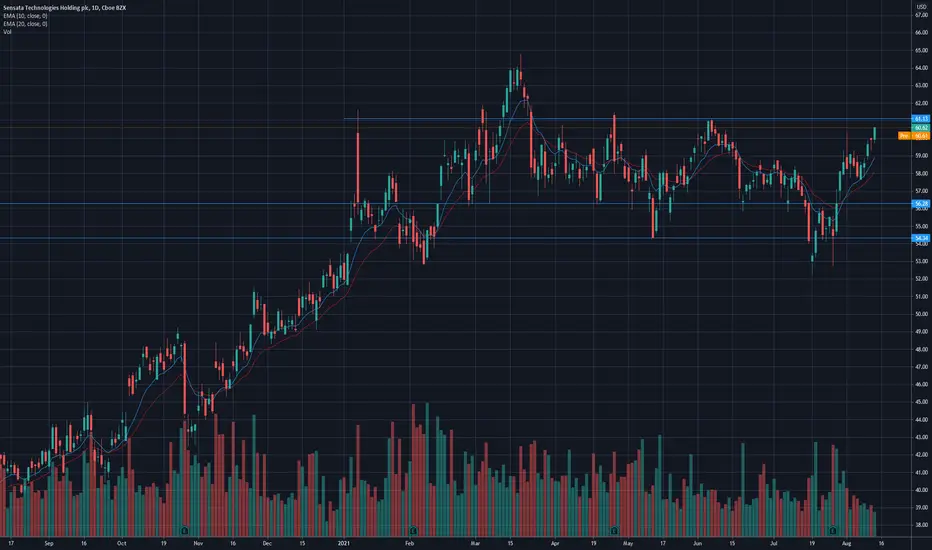
After using the highs from 2015 and 2018 ($56.28) as support, ST is now approaching the resistance of $61.13. Also note that ST has been ranging from year-to-date between $56.28 and $61.13.
Judging from the price action, it seems like ST may break and close above $61.13 in the coming week.
A rejection from $61.13 could have ST test the support of $59.90
Look for buying opportunities:
* Around the $59.90 area
OR
* After a daily close above $61.13
Judging from the price action, it seems like ST may break and close above $61.13 in the coming week.
A rejection from $61.13 could have ST test the support of $59.90
Look for buying opportunities:
* Around the $59.90 area
OR
* After a daily close above $61.13

Haftungsausschluss
Die Informationen und Veröffentlichungen sind nicht als Finanz-, Anlage-, Handels- oder andere Arten von Ratschlägen oder Empfehlungen gedacht, die von TradingView bereitgestellt oder gebilligt werden, und stellen diese nicht dar. Lesen Sie mehr in den Nutzungsbedingungen.
Haftungsausschluss
Die Informationen und Veröffentlichungen sind nicht als Finanz-, Anlage-, Handels- oder andere Arten von Ratschlägen oder Empfehlungen gedacht, die von TradingView bereitgestellt oder gebilligt werden, und stellen diese nicht dar. Lesen Sie mehr in den Nutzungsbedingungen.