Long
Strat long term Chart analysis
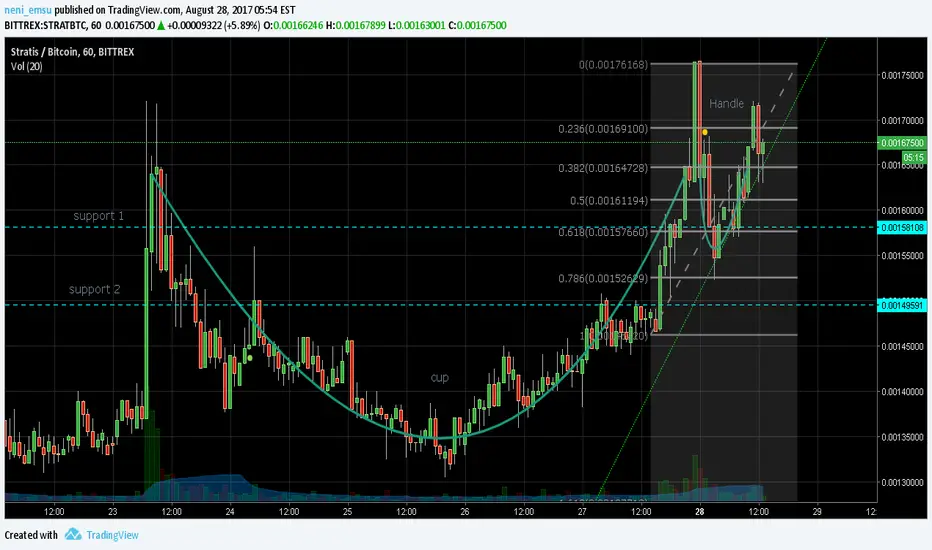
-A nice rounded bottom chart seen as the cup and handle formation comes in for a possible bullish trend confirmed by the new uptrend formed by the second part of the handle.
-Volume seams to have significantly increased.
-MACD indicates a short correction and also an increase in momentum
-If the candles break bellow trend line it would be expected to bounce at the support 1 61.8 Fibonacci line which is also a strongly tested support level.
-Further correction would see the charts move towards the second support and possibly a massive swing up.
Note:
-check for mote information Fundamental and Sentimental analysis to support finding before proceeding.
Do comment your thoughts and questions, Thank you.
-Volume seams to have significantly increased.
-MACD indicates a short correction and also an increase in momentum
-If the candles break bellow trend line it would be expected to bounce at the support 1 61.8 Fibonacci line which is also a strongly tested support level.
-Further correction would see the charts move towards the second support and possibly a massive swing up.
Note:
-check for mote information Fundamental and Sentimental analysis to support finding before proceeding.
Do comment your thoughts and questions, Thank you.

Haftungsausschluss
Die Informationen und Veröffentlichungen sind nicht als Finanz-, Anlage-, Handels- oder andere Arten von Ratschlägen oder Empfehlungen gedacht, die von TradingView bereitgestellt oder gebilligt werden, und stellen diese nicht dar. Lesen Sie mehr in den Nutzungsbedingungen.
Haftungsausschluss
Die Informationen und Veröffentlichungen sind nicht als Finanz-, Anlage-, Handels- oder andere Arten von Ratschlägen oder Empfehlungen gedacht, die von TradingView bereitgestellt oder gebilligt werden, und stellen diese nicht dar. Lesen Sie mehr in den Nutzungsbedingungen.