
Technical Analysis, Analysis, Metrics
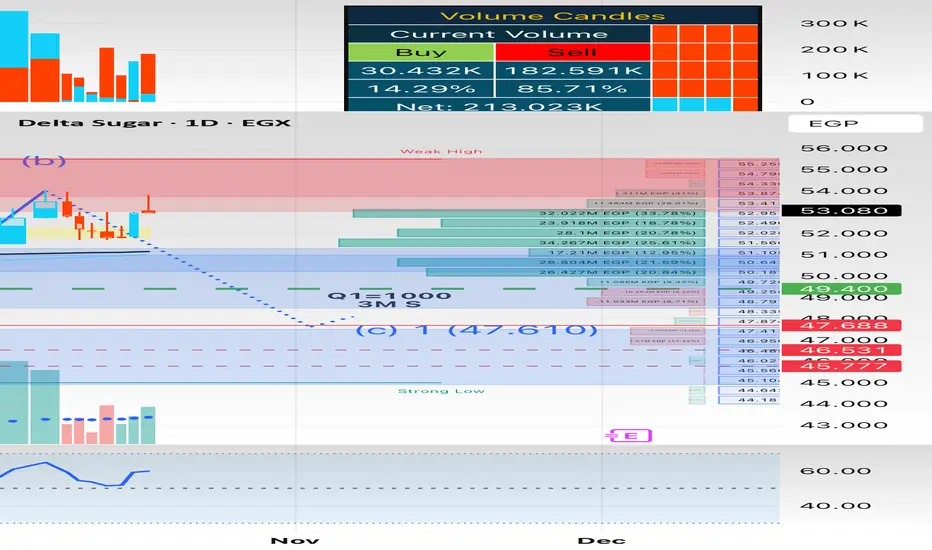
Delta Sugar Company (CASE:SUGR) is trading at **E£53.08**, with technicals flashing a **strong buy** across most timeframes and a consensus analyst target signaling an **81% upside**. But here’s where savvy traders perk up—a Wyckoff lens suggests we’re at a pivotal stage with accumulation signals stacking up, even as sentiment and fundamentals send mixed signals.
🚦 Wyckoff: Accumulation or Markup?
Wyckoff Analysis (Daily Chart):
Price Action: CASE:SUGR bounced off its 52-week low (E£43.95) and is consolidating just under mid-range resistance (E£53.35–E£54.50).
Volume Clues: Average 3-month volume is modest (E£237,710), and today’s volume (159,890) is typical—not climactic. No sign of panic selling, supporting the case for Phase C (Spring/Test) of accumulation or early markup.
Trend Structure: Multiple moving averages (SMA/EMA 5–200) are in full bullish alignment—classic Wyckoff “markup” phase indicator.
Wyckoff Takeaway:
Delta Sugar is in a late accumulation or early markup phase. With strong technical “buy” signals and resistance just above, a breakout (with volume) could kick off a sustained markup. If it stalls or dips below E£52.20, the spring could turn to a shakeout.
📈 Technicals: Bullish Engines Firing
Momentum: RSI (59.9), MACD (+0.29), and ADX (42.3) all indicate bullish momentum.
Indicators: 8 out of 11 daily indicators are “Buy” with only Ultimate Oscillator shouting “Sell.”
Moving Averages: All daily and weekly SMAs/EMAs trigger “Buy” or “Strong Buy.”
Key Levels to Watch:
Resistance: E£53.35 (R1), E£54.50 (R3), with annual high at E£68.00.
Support: E£52.20 (S1), E£51.45 (S2), and the 52-week low at E£43.95.
💰 Valuation: Cheap for a Reason?
P/E (LTM): 9.9x—low for the sector, but negative free cash flow yield (-39.1%) and declining revenue (-25.4%) are red flags.
Dividend: A juicy 10.4% yield, boosted by 3 years of increases.
Growth Outlook: Analysts forecast a 41.8% revenue rebound this year, but net income is expected to drop—classic value trap risk.
Risk: Altman Z-score of
Pro+
signals financial strength, but a Piotroski score of 3 and shareholder yield of -23.1% point to some underlying
🧠 WarrenAI’s Take: Big Upside, But Buyer Beware
Wyckoff says: Accumulation/early markup—bulls have the momentum, but need a convincing breakout above E£54.50 (with volume).
Technicals say: Strong buy trend, but short-term overbought risk if price stumbles at resistance.
Fundamentals say: Cheap by P/E, big dividend, but cash burn and negative FCF yield mean risk is real. Next earnings in
Pro+
days could be decisive.
Bottom Line:
Delta Sugar offers a compelling technical breakout scenario with a fat dividend, but don’t ignore the fundamental cracks. Traders should watch for a breakout above E£54.50 with volume. A failure there could mean more sideways grinding in Wyckoff’s “reaccumulation” zone.
The low value of Fair Value is 67 EGP/share and highest is 135 EGP/share good luck
Delta Sugar Company (CASE:SUGR) is trading at **E£53.08**, with technicals flashing a **strong buy** across most timeframes and a consensus analyst target signaling an **81% upside**. But here’s where savvy traders perk up—a Wyckoff lens suggests we’re at a pivotal stage with accumulation signals stacking up, even as sentiment and fundamentals send mixed signals.
🚦 Wyckoff: Accumulation or Markup?
Wyckoff Analysis (Daily Chart):
Price Action: CASE:SUGR bounced off its 52-week low (E£43.95) and is consolidating just under mid-range resistance (E£53.35–E£54.50).
Volume Clues: Average 3-month volume is modest (E£237,710), and today’s volume (159,890) is typical—not climactic. No sign of panic selling, supporting the case for Phase C (Spring/Test) of accumulation or early markup.
Trend Structure: Multiple moving averages (SMA/EMA 5–200) are in full bullish alignment—classic Wyckoff “markup” phase indicator.
Wyckoff Takeaway:
Delta Sugar is in a late accumulation or early markup phase. With strong technical “buy” signals and resistance just above, a breakout (with volume) could kick off a sustained markup. If it stalls or dips below E£52.20, the spring could turn to a shakeout.
📈 Technicals: Bullish Engines Firing
Momentum: RSI (59.9), MACD (+0.29), and ADX (42.3) all indicate bullish momentum.
Indicators: 8 out of 11 daily indicators are “Buy” with only Ultimate Oscillator shouting “Sell.”
Moving Averages: All daily and weekly SMAs/EMAs trigger “Buy” or “Strong Buy.”
Key Levels to Watch:
Resistance: E£53.35 (R1), E£54.50 (R3), with annual high at E£68.00.
Support: E£52.20 (S1), E£51.45 (S2), and the 52-week low at E£43.95.
💰 Valuation: Cheap for a Reason?
P/E (LTM): 9.9x—low for the sector, but negative free cash flow yield (-39.1%) and declining revenue (-25.4%) are red flags.
Dividend: A juicy 10.4% yield, boosted by 3 years of increases.
Growth Outlook: Analysts forecast a 41.8% revenue rebound this year, but net income is expected to drop—classic value trap risk.
Risk: Altman Z-score of
Pro+
signals financial strength, but a Piotroski score of 3 and shareholder yield of -23.1% point to some underlying
🧠 WarrenAI’s Take: Big Upside, But Buyer Beware
Wyckoff says: Accumulation/early markup—bulls have the momentum, but need a convincing breakout above E£54.50 (with volume).
Technicals say: Strong buy trend, but short-term overbought risk if price stumbles at resistance.
Fundamentals say: Cheap by P/E, big dividend, but cash burn and negative FCF yield mean risk is real. Next earnings in
Pro+
days could be decisive.
Bottom Line:
Delta Sugar offers a compelling technical breakout scenario with a fat dividend, but don’t ignore the fundamental cracks. Traders should watch for a breakout above E£54.50 with volume. A failure there could mean more sideways grinding in Wyckoff’s “reaccumulation” zone.
The low value of Fair Value is 67 EGP/share and highest is 135 EGP/share good luck

Haftungsausschluss
Die Informationen und Veröffentlichungen sind nicht als Finanz-, Anlage-, Handels- oder andere Arten von Ratschlägen oder Empfehlungen gedacht, die von TradingView bereitgestellt oder gebilligt werden, und stellen diese nicht dar. Lesen Sie mehr in den Nutzungsbedingungen.
Haftungsausschluss
Die Informationen und Veröffentlichungen sind nicht als Finanz-, Anlage-, Handels- oder andere Arten von Ratschlägen oder Empfehlungen gedacht, die von TradingView bereitgestellt oder gebilligt werden, und stellen diese nicht dar. Lesen Sie mehr in den Nutzungsbedingungen.