
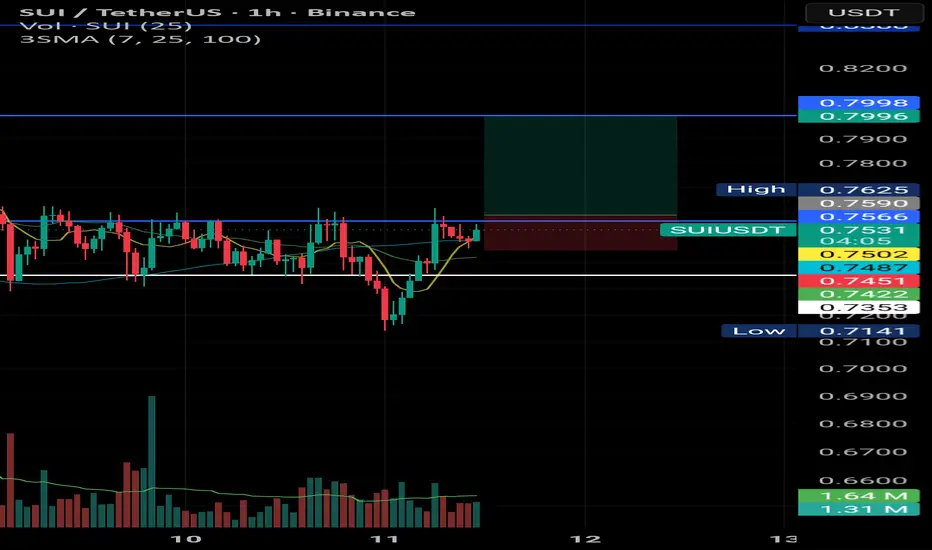
After a fake breakdown below the range low at 0.7353, price managed to reclaim the range and is now testing the 0.7566 resistance level.
A breakout above this level would complete a V-shaped recovery and could increase the probability of further upside.
Momentum indicators are showing signs of strengthening, with RSI moving toward the overbought region, suggesting growing buying pressure.
In this scenario, the next key levels to watch are 0.7998 and 0.8388.
A breakout above this level would complete a V-shaped recovery and could increase the probability of further upside.
Momentum indicators are showing signs of strengthening, with RSI moving toward the overbought region, suggesting growing buying pressure.
In this scenario, the next key levels to watch are 0.7998 and 0.8388.

Haftungsausschluss
Die Informationen und Veröffentlichungen sind nicht als Finanz-, Anlage-, Handels- oder andere Arten von Ratschlägen oder Empfehlungen gedacht, die von TradingView bereitgestellt oder gebilligt werden, und stellen diese nicht dar. Lesen Sie mehr in den Nutzungsbedingungen.
Haftungsausschluss
Die Informationen und Veröffentlichungen sind nicht als Finanz-, Anlage-, Handels- oder andere Arten von Ratschlägen oder Empfehlungen gedacht, die von TradingView bereitgestellt oder gebilligt werden, und stellen diese nicht dar. Lesen Sie mehr in den Nutzungsbedingungen.