SUNTV1!
27-11
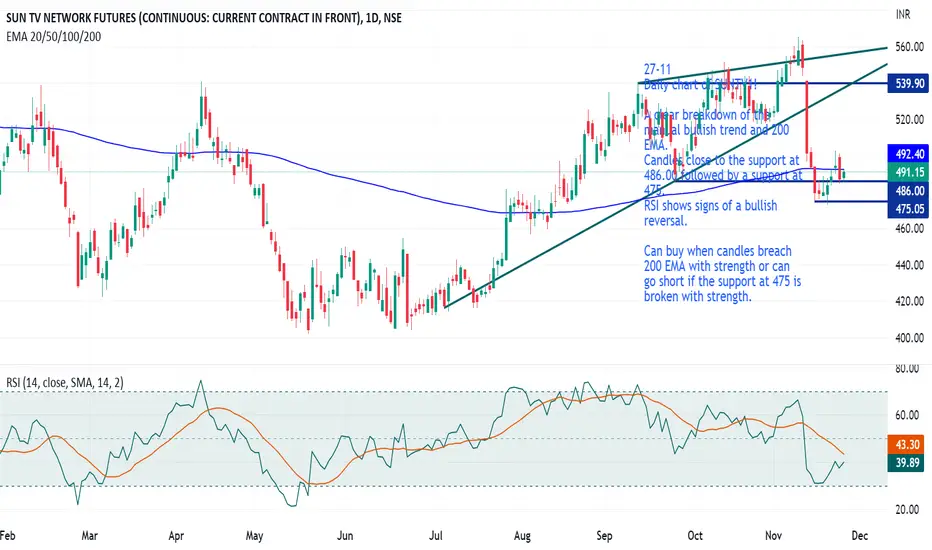
Daily chart of SUNTV1!
A clear breakdown of the manual bullish trend and 200 EMA.
Candles close to the support at 486.00 followed by a support at 475.
RSI shows signs of a bullish reversal.
Can buy when candles breach 200 EMA with strength or can go short if the support at 475 is broken with strength.
Daily chart of SUNTV1!
A clear breakdown of the manual bullish trend and 200 EMA.
Candles close to the support at 486.00 followed by a support at 475.
RSI shows signs of a bullish reversal.
Can buy when candles breach 200 EMA with strength or can go short if the support at 475 is broken with strength.

Haftungsausschluss
Die Informationen und Veröffentlichungen sind nicht als Finanz-, Anlage-, Handels- oder andere Arten von Ratschlägen oder Empfehlungen gedacht, die von TradingView bereitgestellt oder gebilligt werden, und stellen diese nicht dar. Lesen Sie mehr in den Nutzungsbedingungen.
Haftungsausschluss
Die Informationen und Veröffentlichungen sind nicht als Finanz-, Anlage-, Handels- oder andere Arten von Ratschlägen oder Empfehlungen gedacht, die von TradingView bereitgestellt oder gebilligt werden, und stellen diese nicht dar. Lesen Sie mehr in den Nutzungsbedingungen.