
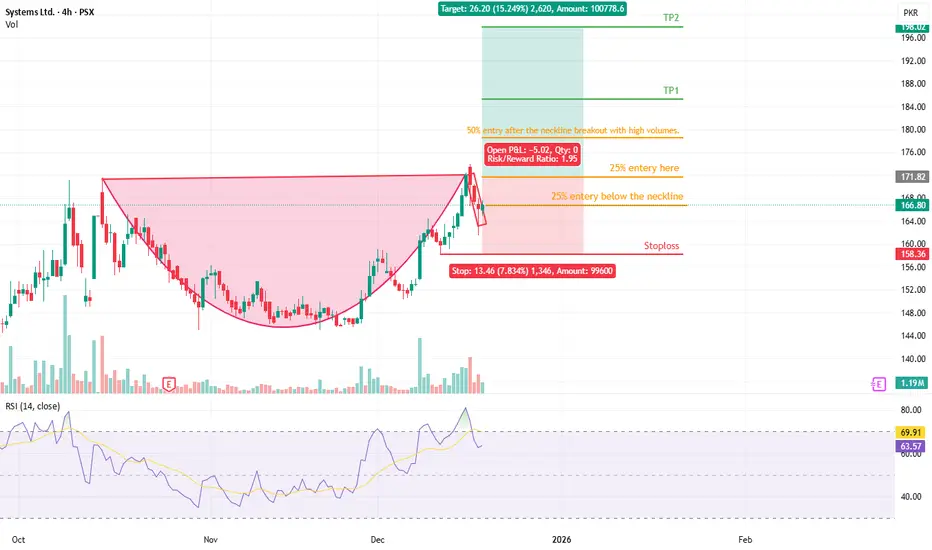
SYS is forming a solid Cup & Handle structure.
Plan:
25% entry below the neckline (handle zone)
25% at neckline
50% on breakout with strong volume
Entry: 171.70
SL: 158.16
TP1: 185.24
TP2: 198.78
Pattern remains bullish above SL.
Fundamental Boost: Systems Limited plans to acquire Confiz, signaling expansion and future growth potential.
Earnings Strength: The company reported a 46% jump in 9MFY25 profit, supporting a continued bullish outlook.
Key Fundamental Highlights (Systems Ltd)
EPS Growth (YoY): +42.3% — very strong earnings expansion momentum.
Net Profit Margin: 13.02% — solid profitability for a tech services firm.
ROE: 24.28% — excellent return generation, shows strong management efficiency.
ROA: 17.2% — highly productive use of assets.
Current Ratio: 3.09 — strong liquidity, low balance-sheet stress.
Debt to Equity: 4.6% — almost debt-free structure, financially stable.
P/E Ratio: 24.56 — fair for a high-growth tech company; not overpriced.
Price to Sales: 3.21 — valuation still growth-based but reasonable.
Enterprise Value to EBITDA: 19.57 — growth stock valuation premium, but within acceptable range.
Equity YoY Growth: +25.43% — strong capital expansion phase.
Net Sales YoY Growth: +18.9% — revenue pipeline expanding.
Book Value/Share: PKR 31.11 vs Price PKR 167 — valuation premium, typical for tech leaders.
Disclaimer:
This idea is for educational and research purposes only, based on technical patterns. It is not investment advice. Always conduct your own analysis (DYOR) and manage your risk carefully before entering any trade.

Haftungsausschluss
Die Informationen und Veröffentlichungen sind nicht als Finanz-, Anlage-, Handels- oder andere Arten von Ratschlägen oder Empfehlungen gedacht, die von TradingView bereitgestellt oder gebilligt werden, und stellen diese nicht dar. Lesen Sie mehr in den Nutzungsbedingungen.
Haftungsausschluss
Die Informationen und Veröffentlichungen sind nicht als Finanz-, Anlage-, Handels- oder andere Arten von Ratschlägen oder Empfehlungen gedacht, die von TradingView bereitgestellt oder gebilligt werden, und stellen diese nicht dar. Lesen Sie mehr in den Nutzungsbedingungen.