
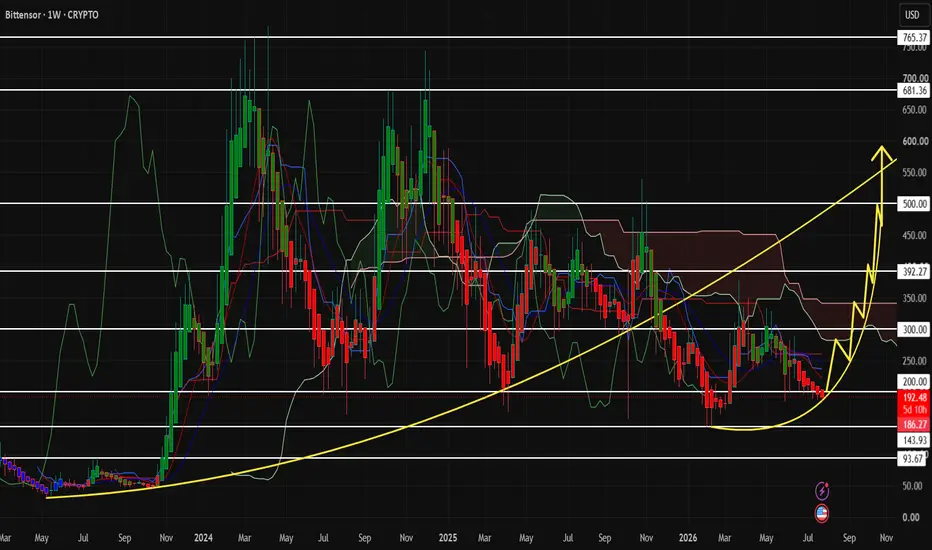
The weekly chart is telling a very interesting story.
After months of relentless selling, TAO has finally returned to one of the strongest historical demand zones on the chart ($180-$200). Every major cycle started after this area held.
What I'm seeing:
✅ Multi-month support holding around $180
✅ Price is compressing after a long downtrend
✅ Risk/reward is becoming extremely attractive
✅ Previous resistance levels are clearly mapped above
The way I see it, this is a classic accumulation structure.
If buyers can defend this zone and reclaim the first resistance around $300, momentum could accelerate quickly.
After that the roadmap becomes surprisingly clean:
🎯 $300 → first confirmation
🎯 $390 → major resistance
🎯 $500 → key breakout level
Once price closes convincingly above $500, there's relatively little historical resistance until the $600-$700 region, where previous weekly highs sit.
The long-term trendline from the cycle lows is also still intact, suggesting the broader market structure hasn't completely broken despite the prolonged correction.
This isn't about predicting the future—it's about identifying a level where the upside could significantly outweigh the downside if the support continues to hold.
My invalidation: a decisive weekly close below the $180 support would weaken this bullish setup.
Until then, I'm watching for confirmation rather than chasing price.
Patience during accumulation often looks boring... until it isn't.
After months of relentless selling, TAO has finally returned to one of the strongest historical demand zones on the chart ($180-$200). Every major cycle started after this area held.
What I'm seeing:
✅ Multi-month support holding around $180
✅ Price is compressing after a long downtrend
✅ Risk/reward is becoming extremely attractive
✅ Previous resistance levels are clearly mapped above
The way I see it, this is a classic accumulation structure.
If buyers can defend this zone and reclaim the first resistance around $300, momentum could accelerate quickly.
After that the roadmap becomes surprisingly clean:
🎯 $300 → first confirmation
🎯 $390 → major resistance
🎯 $500 → key breakout level
Once price closes convincingly above $500, there's relatively little historical resistance until the $600-$700 region, where previous weekly highs sit.
The long-term trendline from the cycle lows is also still intact, suggesting the broader market structure hasn't completely broken despite the prolonged correction.
This isn't about predicting the future—it's about identifying a level where the upside could significantly outweigh the downside if the support continues to hold.
My invalidation: a decisive weekly close below the $180 support would weaken this bullish setup.
Until then, I'm watching for confirmation rather than chasing price.
Patience during accumulation often looks boring... until it isn't.

Haftungsausschluss
Die Informationen und Veröffentlichungen sind nicht als Finanz-, Anlage-, Handels- oder andere Arten von Ratschlägen oder Empfehlungen gedacht, die von TradingView bereitgestellt oder gebilligt werden, und stellen diese nicht dar. Lesen Sie mehr in den Nutzungsbedingungen.
Haftungsausschluss
Die Informationen und Veröffentlichungen sind nicht als Finanz-, Anlage-, Handels- oder andere Arten von Ratschlägen oder Empfehlungen gedacht, die von TradingView bereitgestellt oder gebilligt werden, und stellen diese nicht dar. Lesen Sie mehr in den Nutzungsbedingungen.