
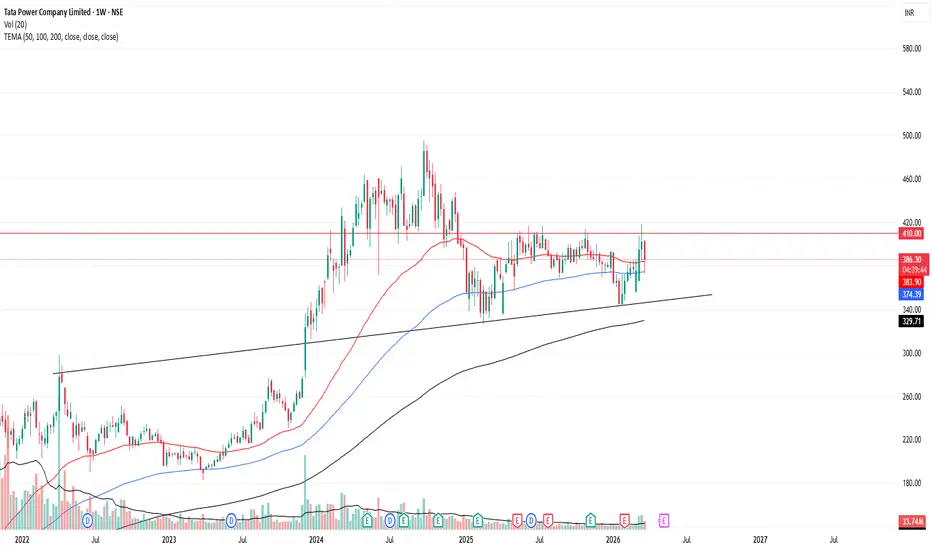
Chart View (Weekly Timeframe)
Price is consolidating between ₹370–₹410
Strong resistance around ₹410–₹420
Support zone near ₹350–₹360
Price is trading:
Around 50 EMA (short-term control)
Above 100 & 200 EMA → long-term uptrend intact
Forming a Double Bottom formation
Structure:
Big rally → Distribution → Now range accumulation
👉 This looks like a base-building phase after a strong uptrend
Bullish Scenario (High Probability if breakout comes)
Weekly close above ₹410
Target zones:
₹450 (previous supply)
₹500+ (trend continuation)
➡️ This will confirm range breakout + continuation of primary uptrend
Fundamental Trigger – Power Demand Explosion
India’s power demand is massively rising, which is a big structural tailwind:
Peak demand expected to hit ~270 GW in 2026 (record high)
Long-term demand may reach 459 GW by 2036
Electricity consumption growing ~6–6.5% annually
👉 This is not a short-term story — it's a decade-long growth cycle
Key highlights:
Government ordered Tata Power’s 4 GW Mundra plant to run at full capacity to meet summer demand
New power purchase agreements (PPAs) signed → stable revenue visibility
India nearing 24x7 electricity supply with strong infra push
Rising demand due to heatwaves + industrial growth
👉 Even coal plants are being restarted → shows real demand pressure
Demand Drivers (Why Power Stocks Can Outperform)
🏭 Industrial consumption = ~43% of total demand
🧠 Data centers demand exploding (AI boom)
🚗 EV adoption increasing electricity load
☀️ Renewable capacity growing rapidly (solar + wind)
Conclusion
Technical: Range-bound, waiting for breakout
Fundamental: Extremely strong long-term demand
Trigger: ₹410 breakout can lead to sharp upside
👉 Tata Power is a "structure + story" stock right now
Disclaimer - This is for educational purpose only. Take financial advise from your financial advisor before investing.
Price is consolidating between ₹370–₹410
Strong resistance around ₹410–₹420
Support zone near ₹350–₹360
Price is trading:
Around 50 EMA (short-term control)
Above 100 & 200 EMA → long-term uptrend intact
Forming a Double Bottom formation
Structure:
Big rally → Distribution → Now range accumulation
👉 This looks like a base-building phase after a strong uptrend
Bullish Scenario (High Probability if breakout comes)
Weekly close above ₹410
Target zones:
₹450 (previous supply)
₹500+ (trend continuation)
➡️ This will confirm range breakout + continuation of primary uptrend
Fundamental Trigger – Power Demand Explosion
India’s power demand is massively rising, which is a big structural tailwind:
Peak demand expected to hit ~270 GW in 2026 (record high)
Long-term demand may reach 459 GW by 2036
Electricity consumption growing ~6–6.5% annually
👉 This is not a short-term story — it's a decade-long growth cycle
Key highlights:
Government ordered Tata Power’s 4 GW Mundra plant to run at full capacity to meet summer demand
New power purchase agreements (PPAs) signed → stable revenue visibility
India nearing 24x7 electricity supply with strong infra push
Rising demand due to heatwaves + industrial growth
👉 Even coal plants are being restarted → shows real demand pressure
Demand Drivers (Why Power Stocks Can Outperform)
🏭 Industrial consumption = ~43% of total demand
🧠 Data centers demand exploding (AI boom)
🚗 EV adoption increasing electricity load
☀️ Renewable capacity growing rapidly (solar + wind)
Conclusion
Technical: Range-bound, waiting for breakout
Fundamental: Extremely strong long-term demand
Trigger: ₹410 breakout can lead to sharp upside
👉 Tata Power is a "structure + story" stock right now
Disclaimer - This is for educational purpose only. Take financial advise from your financial advisor before investing.
Trade geschlossen: Ziel wurde erreicht
1ST TARGET ACHIEVED. 
Haftungsausschluss
Die Informationen und Veröffentlichungen sind nicht als Finanz-, Anlage-, Handels- oder andere Arten von Ratschlägen oder Empfehlungen gedacht, die von TradingView bereitgestellt oder gebilligt werden, und stellen diese nicht dar. Lesen Sie mehr in den Nutzungsbedingungen.
Haftungsausschluss
Die Informationen und Veröffentlichungen sind nicht als Finanz-, Anlage-, Handels- oder andere Arten von Ratschlägen oder Empfehlungen gedacht, die von TradingView bereitgestellt oder gebilligt werden, und stellen diese nicht dar. Lesen Sie mehr in den Nutzungsbedingungen.