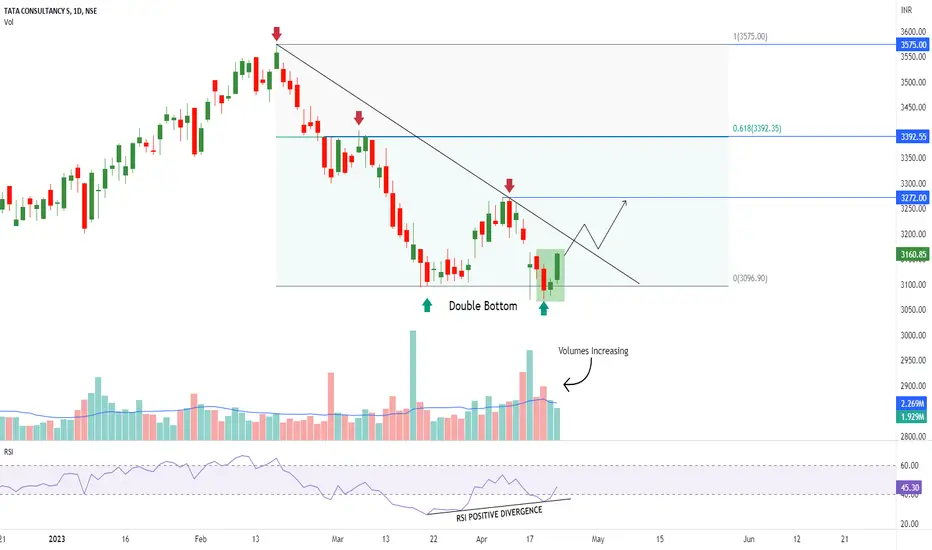
 TCS is trading at its important weekly support level.
On Daily chart it has formed kind of Morning Star Candlestick Pattern & Double Bottom Price Action Pattern.
Positive RSI Divergence is also seen.
Volume is still rising, which suggests that there is more upside potential for the stock.
- Support- 3100
Resistance- 3275/3400/3575

Haftungsausschluss
Die Informationen und Veröffentlichungen sind nicht als Finanz-, Anlage-, Handels- oder andere Arten von Ratschlägen oder Empfehlungen gedacht, die von TradingView bereitgestellt oder gebilligt werden, und stellen diese nicht dar. Lesen Sie mehr in den Nutzungsbedingungen.
Haftungsausschluss
Die Informationen und Veröffentlichungen sind nicht als Finanz-, Anlage-, Handels- oder andere Arten von Ratschlägen oder Empfehlungen gedacht, die von TradingView bereitgestellt oder gebilligt werden, und stellen diese nicht dar. Lesen Sie mehr in den Nutzungsbedingungen.