
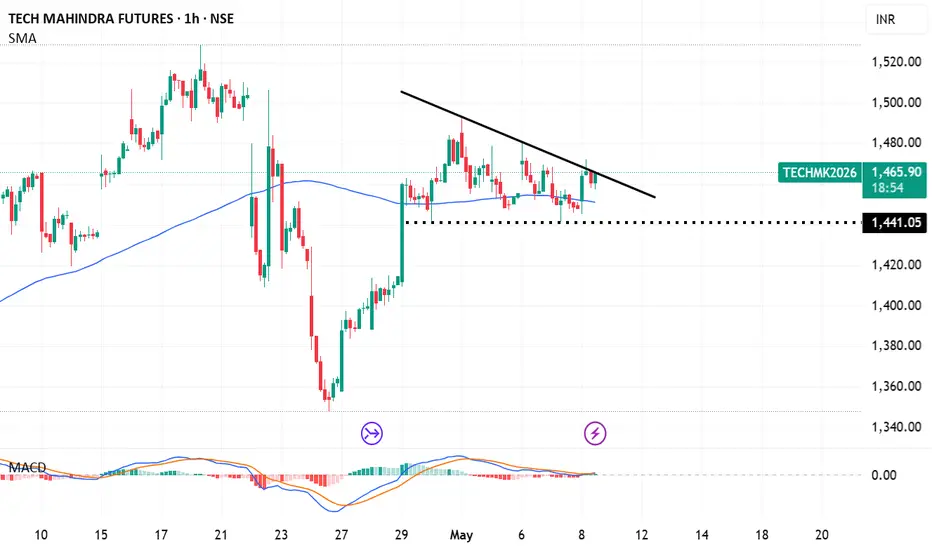
A descending triangle is characterized by a flat support line and a descending resistance line. For a Buy setup, you are looking for a bullish breakout above the downward-sloping resistance line, often triggered by a trend reversal or a "failed" bearish pattern.
Entry Point: Buy above the upper descending resistance line (currently near ₹1,465) once a candle closes above it on the hourly timeframe.
Stop-loss: ₹1,430 (Placed below the flat support base of the triangle to protect against a breakdown).
Target: ₹1,530 (This aligns with major psychological resistance and recent swing highs).
Entry Point: Buy above the upper descending resistance line (currently near ₹1,465) once a candle closes above it on the hourly timeframe.
Stop-loss: ₹1,430 (Placed below the flat support base of the triangle to protect against a breakdown).
Target: ₹1,530 (This aligns with major psychological resistance and recent swing highs).

Haftungsausschluss
Die Informationen und Veröffentlichungen sind nicht als Finanz-, Anlage-, Handels- oder andere Arten von Ratschlägen oder Empfehlungen gedacht, die von TradingView bereitgestellt oder gebilligt werden, und stellen diese nicht dar. Lesen Sie mehr in den Nutzungsbedingungen.
Haftungsausschluss
Die Informationen und Veröffentlichungen sind nicht als Finanz-, Anlage-, Handels- oder andere Arten von Ratschlägen oder Empfehlungen gedacht, die von TradingView bereitgestellt oder gebilligt werden, und stellen diese nicht dar. Lesen Sie mehr in den Nutzungsbedingungen.