
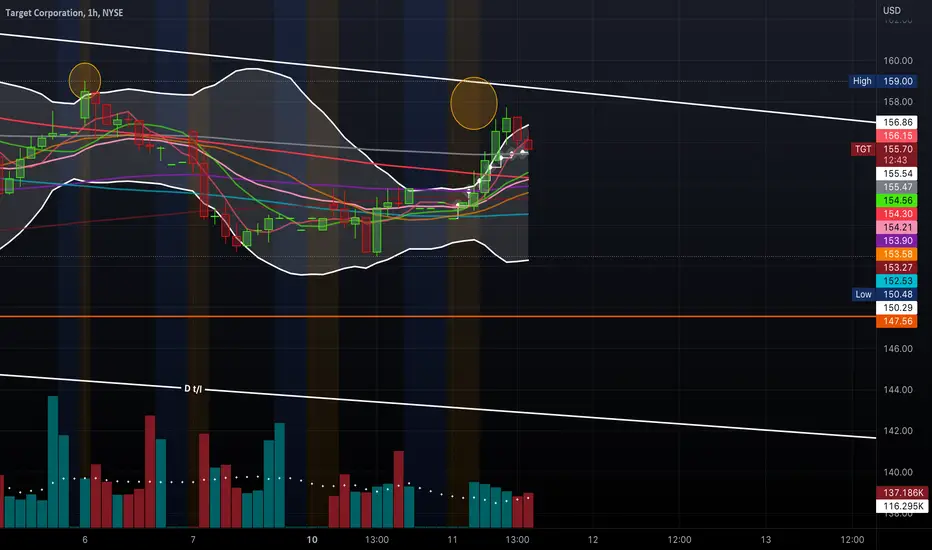
Target With A "Bullseye"?
I've identified a falling wedge pattern on Target's daily chart. Also, the RSI indicator shows higher highs and higher lows.
Short float % for TGT was at 2.02% at time of this post.
TGT is a good candidate for a swing. I have my "Bullseye" above 159 or at the break of the upper trendline.

*This is not financial advice.
I've identified a falling wedge pattern on Target's daily chart. Also, the RSI indicator shows higher highs and higher lows.
Short float % for TGT was at 2.02% at time of this post.
TGT is a good candidate for a swing. I have my "Bullseye" above 159 or at the break of the upper trendline.
*This is not financial advice.

Haftungsausschluss
Die Informationen und Veröffentlichungen sind nicht als Finanz-, Anlage-, Handels- oder andere Arten von Ratschlägen oder Empfehlungen gedacht, die von TradingView bereitgestellt oder gebilligt werden, und stellen diese nicht dar. Lesen Sie mehr in den Nutzungsbedingungen.
Haftungsausschluss
Die Informationen und Veröffentlichungen sind nicht als Finanz-, Anlage-, Handels- oder andere Arten von Ratschlägen oder Empfehlungen gedacht, die von TradingView bereitgestellt oder gebilligt werden, und stellen diese nicht dar. Lesen Sie mehr in den Nutzungsbedingungen.