
TITAN Cement: Low Carbon, Low Debt, Low Price — But for How Long?
The Greek cement giant TITAN (TITC) is quietly building momentum. Despite a flat top line (+0.4% revenue YoY in H1 2025), TITAN grew EBITDA by 2% to €286.9M, boosted by cost control and a strategic shift to alternative fuels. In Greece, EBITDA soared 20% on the back of construction activity and expense discipline.
The group’s net debt plummeted from €622M to €137M in just six months, with a Net Debt/EBITDA ratio of 0.2x—unlocking major optionality for M\&A, dividends, or buybacks.
But what really stands out?
- ESG Competitive Moat: TITAN leads in low-carbon cement (CEM IV), positioning itself ahead of regulatory curves across the EU. Alternative fuels now account for 40%+ in some regions.
- Valuation Disconnect: The stock trades at just 4.7x EV/EBITDA, while ESG peers sit at 6–7.5x. A rerating could imply up to 60% upside.
- Strong Catalysts Ahead:
1. U.S. housing rebound in 2025–26 (Titan America exposure)
2. Buybacks/dividend hike due to surplus cash flow
3. Entry into EU/EIB-funded green projects
4. Second IPO or spin-off of Titan America or ESG vertical
5. Technical Setup:
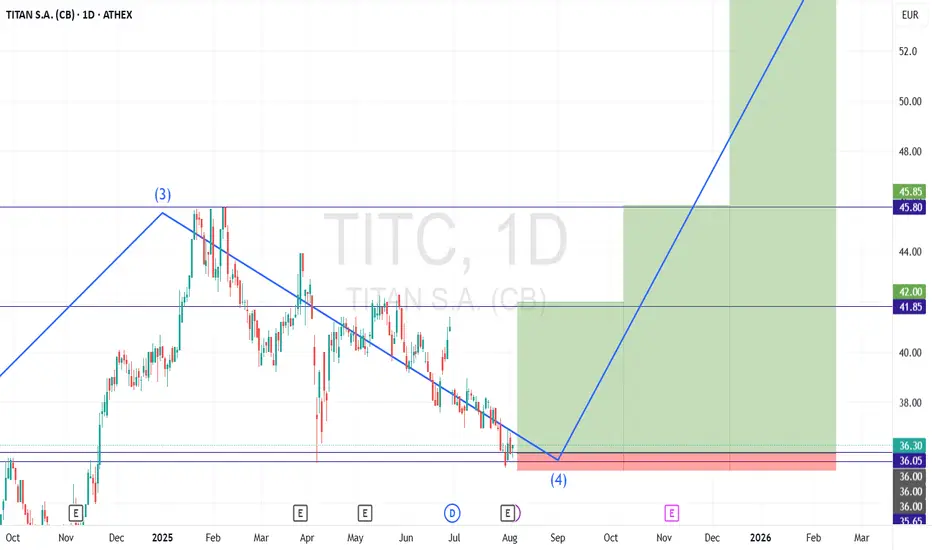
i) Price is testing long-term ascending channel support (€34.30–€35.50), with a potential upside target of €55.30 (+52%).
ii) Currently in Wave 4 of the Elliott Wave cycle on the monthly timeframe, suggesting a potential Wave 5 rally ahead.
iii) Entering a key value-buying zone — the same price region where the April 2025 bullish rally was initiated.
Conclusion: TITAN is underpriced, under-leveraged, and ESG-ready. The next 6–18 months could unlock major revaluation.
Ticker: TITC
Watch Zones:
- Entry Area: €34.30–€35.50 (support)
- SL Area: €35-€35.30 (below latest swing low)
-TP1 Area: €42 (target 1 - Previous consolidation levels) - R:R 8.57
-TP2 Area: €45.85 (target 2 - Previous Highs) - R:R 14.07
-TP3 Area: €55 (target 3 - According to EV/EBITDA Multiples) - R:R 27.07
-Return: From 16.67% to 52.64%
Happy Profits to everyone!!
At your disposal for any questions!!
THE GREEK TRADER
The Greek cement giant TITAN (TITC) is quietly building momentum. Despite a flat top line (+0.4% revenue YoY in H1 2025), TITAN grew EBITDA by 2% to €286.9M, boosted by cost control and a strategic shift to alternative fuels. In Greece, EBITDA soared 20% on the back of construction activity and expense discipline.
The group’s net debt plummeted from €622M to €137M in just six months, with a Net Debt/EBITDA ratio of 0.2x—unlocking major optionality for M\&A, dividends, or buybacks.
But what really stands out?
- ESG Competitive Moat: TITAN leads in low-carbon cement (CEM IV), positioning itself ahead of regulatory curves across the EU. Alternative fuels now account for 40%+ in some regions.
- Valuation Disconnect: The stock trades at just 4.7x EV/EBITDA, while ESG peers sit at 6–7.5x. A rerating could imply up to 60% upside.
- Strong Catalysts Ahead:
1. U.S. housing rebound in 2025–26 (Titan America exposure)
2. Buybacks/dividend hike due to surplus cash flow
3. Entry into EU/EIB-funded green projects
4. Second IPO or spin-off of Titan America or ESG vertical
5. Technical Setup:
i) Price is testing long-term ascending channel support (€34.30–€35.50), with a potential upside target of €55.30 (+52%).
ii) Currently in Wave 4 of the Elliott Wave cycle on the monthly timeframe, suggesting a potential Wave 5 rally ahead.
iii) Entering a key value-buying zone — the same price region where the April 2025 bullish rally was initiated.
Conclusion: TITAN is underpriced, under-leveraged, and ESG-ready. The next 6–18 months could unlock major revaluation.
Ticker: TITC
Watch Zones:
- Entry Area: €34.30–€35.50 (support)
- SL Area: €35-€35.30 (below latest swing low)
-TP1 Area: €42 (target 1 - Previous consolidation levels) - R:R 8.57
-TP2 Area: €45.85 (target 2 - Previous Highs) - R:R 14.07
-TP3 Area: €55 (target 3 - According to EV/EBITDA Multiples) - R:R 27.07
-Return: From 16.67% to 52.64%
Happy Profits to everyone!!
At your disposal for any questions!!
THE GREEK TRADER

Haftungsausschluss
Die Informationen und Veröffentlichungen sind nicht als Finanz-, Anlage-, Handels- oder andere Arten von Ratschlägen oder Empfehlungen gedacht, die von TradingView bereitgestellt oder gebilligt werden, und stellen diese nicht dar. Lesen Sie mehr in den Nutzungsbedingungen.
Haftungsausschluss
Die Informationen und Veröffentlichungen sind nicht als Finanz-, Anlage-, Handels- oder andere Arten von Ratschlägen oder Empfehlungen gedacht, die von TradingView bereitgestellt oder gebilligt werden, und stellen diese nicht dar. Lesen Sie mehr in den Nutzungsbedingungen.