
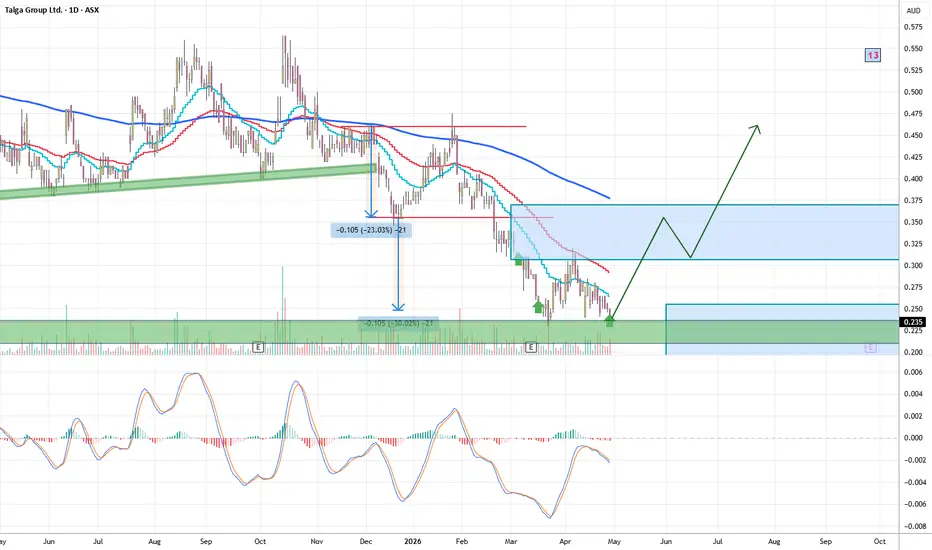
#TLG has been in a steady descent and today tapped into multiple historical lows — a zone that has previously provided support. This area is worth watching closely.
From here, the expectation is a recovery phase. The rally may not be immediate or as quick as the green zig-zag on the chart suggests, but the structure is building. An initial move into the 35–37c range looks reasonable, followed by a potential pullback toward ~31c before a stronger push higher.
If momentum builds, a final leg into ~47c comes into play. Notably, doubling today’s ~23.5c level lands right at 47c — aligning with prior highs from Jan 2026 and Dec 2025, reinforcing this level as a key target.
Patience may be required, but the setup is forming.
From here, the expectation is a recovery phase. The rally may not be immediate or as quick as the green zig-zag on the chart suggests, but the structure is building. An initial move into the 35–37c range looks reasonable, followed by a potential pullback toward ~31c before a stronger push higher.
If momentum builds, a final leg into ~47c comes into play. Notably, doubling today’s ~23.5c level lands right at 47c — aligning with prior highs from Jan 2026 and Dec 2025, reinforcing this level as a key target.
Patience may be required, but the setup is forming.

Haftungsausschluss
Die Informationen und Veröffentlichungen sind nicht als Finanz-, Anlage-, Handels- oder andere Arten von Ratschlägen oder Empfehlungen gedacht, die von TradingView bereitgestellt oder gebilligt werden, und stellen diese nicht dar. Lesen Sie mehr in den Nutzungsbedingungen.
Haftungsausschluss
Die Informationen und Veröffentlichungen sind nicht als Finanz-, Anlage-, Handels- oder andere Arten von Ratschlägen oder Empfehlungen gedacht, die von TradingView bereitgestellt oder gebilligt werden, und stellen diese nicht dar. Lesen Sie mehr in den Nutzungsbedingungen.