
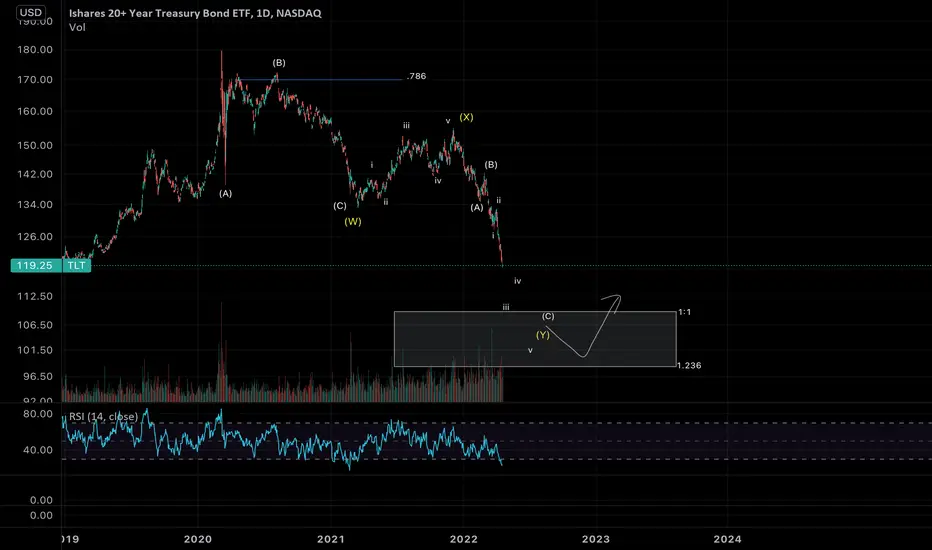
Applying simple Elliot wave analysis, I see an ABC pattern with a failed 5 wave move up marked as X wave, the first ABC is then labeled as W and projected 1:1 ratio from top of (X) brings us down to the box area, where TLT is most likely to find support (1:1 & 1.236 Fib ratio).
I see the price dropping without retest of major resistances that it broke through, and a price fall in a straight line is unsustainable, its like stretching a rubber band and eventually price will rebound violently.
I would give it a 60% probability of reversal at that point and daily bullish divergence should be a very strong sign of imminent reversal.
Cheers
I see the price dropping without retest of major resistances that it broke through, and a price fall in a straight line is unsustainable, its like stretching a rubber band and eventually price will rebound violently.
I would give it a 60% probability of reversal at that point and daily bullish divergence should be a very strong sign of imminent reversal.
Cheers

Haftungsausschluss
Die Informationen und Veröffentlichungen sind nicht als Finanz-, Anlage-, Handels- oder andere Arten von Ratschlägen oder Empfehlungen gedacht, die von TradingView bereitgestellt oder gebilligt werden, und stellen diese nicht dar. Lesen Sie mehr in den Nutzungsbedingungen.
Haftungsausschluss
Die Informationen und Veröffentlichungen sind nicht als Finanz-, Anlage-, Handels- oder andere Arten von Ratschlägen oder Empfehlungen gedacht, die von TradingView bereitgestellt oder gebilligt werden, und stellen diese nicht dar. Lesen Sie mehr in den Nutzungsbedingungen.