Long
TNY Update.
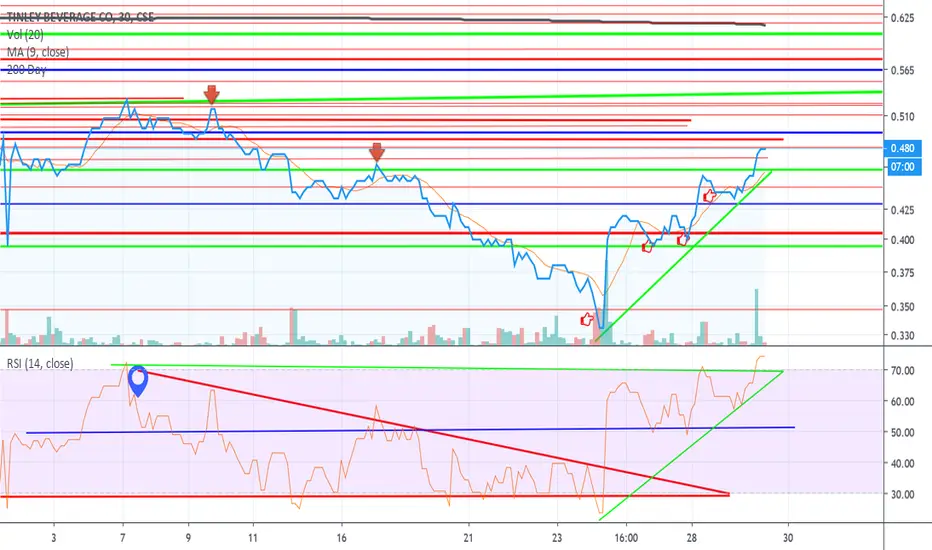
200 Day MA is only 26% away at the time of posting.
Tinley has broken out of a ascending triangle, look at the rsi as well, very telling of a possible trend reversal after creating lower highs for months consecutive. Now Tinley is creating higher highs & higher lows on a micro level consistently. If we do see a retracement of any sort, I'd like to see 46c hold, which is the top of the ascending triangle, and one of the recent lower highs of the continued downtrend is at that level.
On a smaller time frame & chart attached to this one you can notice a bull flag pattern that broke to the upside as well.
Tinley has broken out of a ascending triangle, look at the rsi as well, very telling of a possible trend reversal after creating lower highs for months consecutive. Now Tinley is creating higher highs & higher lows on a micro level consistently. If we do see a retracement of any sort, I'd like to see 46c hold, which is the top of the ascending triangle, and one of the recent lower highs of the continued downtrend is at that level.
On a smaller time frame & chart attached to this one you can notice a bull flag pattern that broke to the upside as well.

Verbundene Veröffentlichungen
Haftungsausschluss
Die Informationen und Veröffentlichungen sind nicht als Finanz-, Anlage-, Handels- oder andere Arten von Ratschlägen oder Empfehlungen gedacht, die von TradingView bereitgestellt oder gebilligt werden, und stellen diese nicht dar. Lesen Sie mehr in den Nutzungsbedingungen.
Verbundene Veröffentlichungen
Haftungsausschluss
Die Informationen und Veröffentlichungen sind nicht als Finanz-, Anlage-, Handels- oder andere Arten von Ratschlägen oder Empfehlungen gedacht, die von TradingView bereitgestellt oder gebilligt werden, und stellen diese nicht dar. Lesen Sie mehr in den Nutzungsbedingungen.