
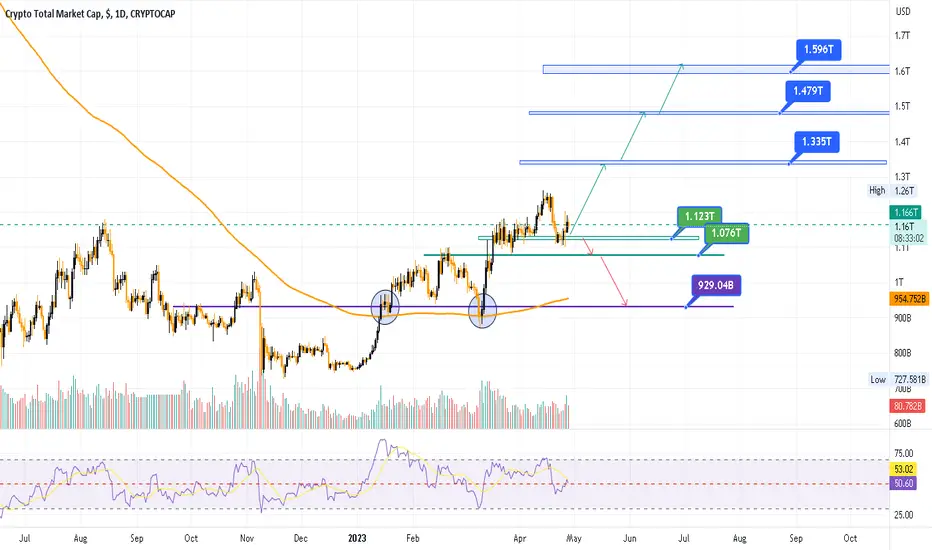
According to the total chart data, we will have two scenarios ahead:
The first scenario : Increase liquidity in the market
According to the chart data, we are now in a support area marked in green, if this area is maintained, we expect liquidity to increase to the blue areas.
Second scenario: decrease in liquidity
If the blue areas that act as support are lost, we will see liquidity fall to the purple area
My personal opinion:
Due to the failure of the average of two hundred days in the chart and its re-pullback
(blue circles), I predict that the first scenario will happen and increase the liquidity in the cryptocurrency market
A smart trade should always have appropriate solutions
Trade smartly
The first scenario : Increase liquidity in the market
According to the chart data, we are now in a support area marked in green, if this area is maintained, we expect liquidity to increase to the blue areas.
Second scenario: decrease in liquidity
If the blue areas that act as support are lost, we will see liquidity fall to the purple area
My personal opinion:
Due to the failure of the average of two hundred days in the chart and its re-pullback
(blue circles), I predict that the first scenario will happen and increase the liquidity in the cryptocurrency market
A smart trade should always have appropriate solutions
Trade smartly

Haftungsausschluss
Die Informationen und Veröffentlichungen sind nicht als Finanz-, Anlage-, Handels- oder andere Arten von Ratschlägen oder Empfehlungen gedacht, die von TradingView bereitgestellt oder gebilligt werden, und stellen diese nicht dar. Lesen Sie mehr in den Nutzungsbedingungen.
Haftungsausschluss
Die Informationen und Veröffentlichungen sind nicht als Finanz-, Anlage-, Handels- oder andere Arten von Ratschlägen oder Empfehlungen gedacht, die von TradingView bereitgestellt oder gebilligt werden, und stellen diese nicht dar. Lesen Sie mehr in den Nutzungsbedingungen.