
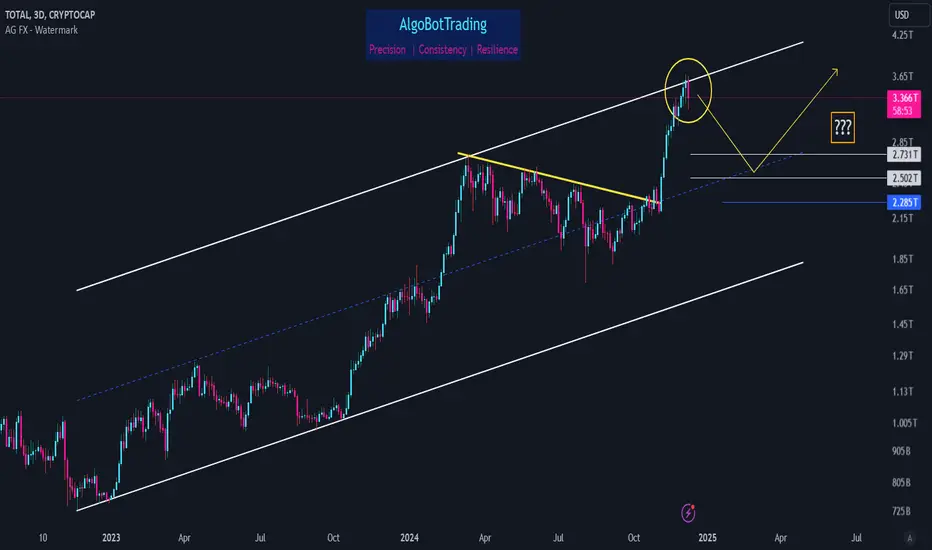
Sometimes a tool as simple as parallel channel can help us identify important support/resistance zones.
Looking at the chart, it's obvious that TOTAL reached 3.6T zone. Not only is this zone the area where a couple of fibs exist, but also it is indeed the upper boundary of the long term ascending channel.
Higher possibility scenario is to see a drop towards 2.5T - 2.73T zone before continuing the rally towards higher level. In order to keep its bullish integrity, TOTAL must not drop below 2.28T level.

Haftungsausschluss
Die Informationen und Veröffentlichungen sind nicht als Finanz-, Anlage-, Handels- oder andere Arten von Ratschlägen oder Empfehlungen gedacht, die von TradingView bereitgestellt oder gebilligt werden, und stellen diese nicht dar. Lesen Sie mehr in den Nutzungsbedingungen.
Haftungsausschluss
Die Informationen und Veröffentlichungen sind nicht als Finanz-, Anlage-, Handels- oder andere Arten von Ratschlägen oder Empfehlungen gedacht, die von TradingView bereitgestellt oder gebilligt werden, und stellen diese nicht dar. Lesen Sie mehr in den Nutzungsbedingungen.