
TOTAL3 EXCLUDING BTC, ETH AND STABLECOINS
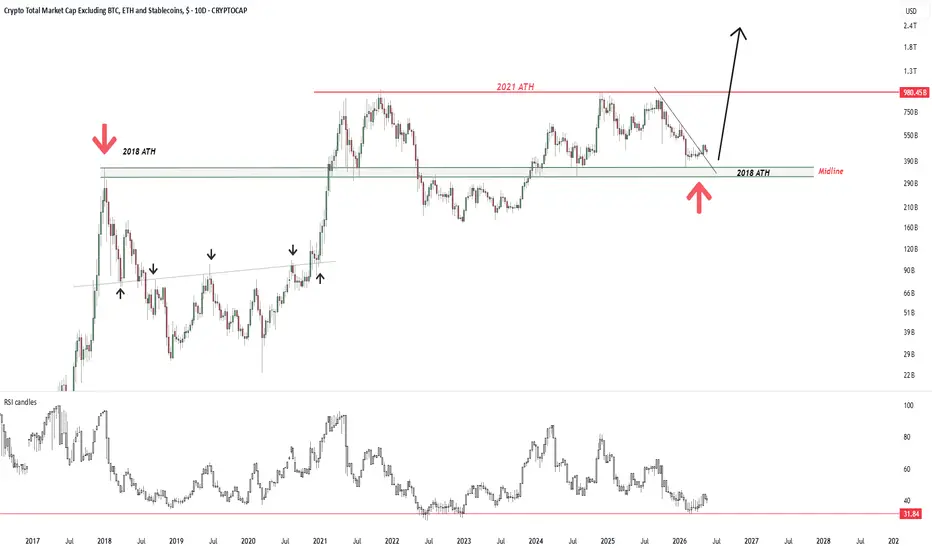
The broader altcoin market is still holding one of the most important structural zones of the entire cycle.
This chart removes Bitcoin, Ethereum and stablecoins from the equation. That makes it useful for reading the deeper risk curve. If this market is healthy, capital is not only staying in BTC or ETH. It is also willing to move further into mid-cap and high-beta crypto assets.
The main structure is clear. The 2018 ATH / midline zone acted as a major historical level. It was resistance in the previous cycle, then later became the structural base for the current cycle. The latest correction has brought TOTAL3 back toward that same area again.
So far, the market is reacting from the right zone.
This is important because previous major altcoin expansions did not begin from euphoria. They began after long corrections, broken sentiment, low momentum and repeated tests of important support. The current structure looks much closer to a rebuild phase than a finished market.
The red line near the 2021 ATH remains the major macro ceiling. Until that zone is reclaimed, this is not full expansion yet. But the market does not need to be in full expansion to be important. The early signal is whether it can hold the old structural base and begin moving away from it.
That is what I am watching here.
The RSI also supports the same idea. It has returned to a low/reset region and is trying to recover. This is not a late-cycle overheated momentum profile. It is a washed-out structure trying to turn.
The descending short-term correction line is also being tested. If the market continues to push above that structure while holding the 2018 ATH / midline area, the chart starts shifting from defensive repair into a stronger recovery attempt.
My read is constructive.
TOTAL3 is still below the 2021 ATH, but the important part is that the base is holding. The broader altcoin market excluding BTC, ETH and stablecoins is not showing a dead structure. It is showing a multi-year rebuild sitting near a major historical level.
The next major phase begins if this market can move away from the midline and eventually challenge the 2021 ATH again.
Until then, this is still preparation.
But it is the kind of preparation that usually matters before the crowd returns.
This chart removes Bitcoin, Ethereum and stablecoins from the equation. That makes it useful for reading the deeper risk curve. If this market is healthy, capital is not only staying in BTC or ETH. It is also willing to move further into mid-cap and high-beta crypto assets.
The main structure is clear. The 2018 ATH / midline zone acted as a major historical level. It was resistance in the previous cycle, then later became the structural base for the current cycle. The latest correction has brought TOTAL3 back toward that same area again.
So far, the market is reacting from the right zone.
This is important because previous major altcoin expansions did not begin from euphoria. They began after long corrections, broken sentiment, low momentum and repeated tests of important support. The current structure looks much closer to a rebuild phase than a finished market.
The red line near the 2021 ATH remains the major macro ceiling. Until that zone is reclaimed, this is not full expansion yet. But the market does not need to be in full expansion to be important. The early signal is whether it can hold the old structural base and begin moving away from it.
That is what I am watching here.
The RSI also supports the same idea. It has returned to a low/reset region and is trying to recover. This is not a late-cycle overheated momentum profile. It is a washed-out structure trying to turn.
The descending short-term correction line is also being tested. If the market continues to push above that structure while holding the 2018 ATH / midline area, the chart starts shifting from defensive repair into a stronger recovery attempt.
My read is constructive.
TOTAL3 is still below the 2021 ATH, but the important part is that the base is holding. The broader altcoin market excluding BTC, ETH and stablecoins is not showing a dead structure. It is showing a multi-year rebuild sitting near a major historical level.
The next major phase begins if this market can move away from the midline and eventually challenge the 2021 ATH again.
Until then, this is still preparation.
But it is the kind of preparation that usually matters before the crowd returns.

▸ Crypto Cycles: cycle phase mapping, structural analysis
▸ Fractals: historical pattern, cycle anatomy
▸ Onchain
▸ Macro
▸ Market Psychology
▸Altcoin Charts
Subscribe on X → @Cryptollica
x.com/Cryptollica/creator-subscriptions/subscribe
▸ Fractals: historical pattern, cycle anatomy
▸ Onchain
▸ Macro
▸ Market Psychology
▸Altcoin Charts
Subscribe on X → @Cryptollica
x.com/Cryptollica/creator-subscriptions/subscribe
Haftungsausschluss
Die Informationen und Veröffentlichungen sind nicht als Finanz-, Anlage-, Handels- oder andere Arten von Ratschlägen oder Empfehlungen gedacht, die von TradingView bereitgestellt oder gebilligt werden, und stellen diese nicht dar. Lesen Sie mehr in den Nutzungsbedingungen.
▸ Crypto Cycles: cycle phase mapping, structural analysis
▸ Fractals: historical pattern, cycle anatomy
▸ Onchain
▸ Macro
▸ Market Psychology
▸Altcoin Charts
Subscribe on X → @Cryptollica
x.com/Cryptollica/creator-subscriptions/subscribe
▸ Fractals: historical pattern, cycle anatomy
▸ Onchain
▸ Macro
▸ Market Psychology
▸Altcoin Charts
Subscribe on X → @Cryptollica
x.com/Cryptollica/creator-subscriptions/subscribe
Haftungsausschluss
Die Informationen und Veröffentlichungen sind nicht als Finanz-, Anlage-, Handels- oder andere Arten von Ratschlägen oder Empfehlungen gedacht, die von TradingView bereitgestellt oder gebilligt werden, und stellen diese nicht dar. Lesen Sie mehr in den Nutzungsbedingungen.