
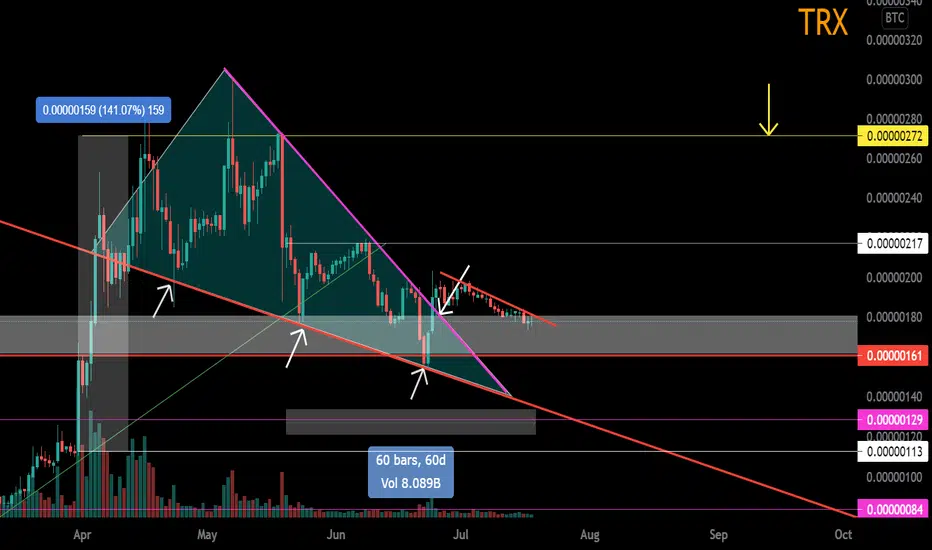
Notice how the wedge formed above the main trend line. The resistance of the wedge has been broken. The pullback.
The price is 2 months in a sideways pattern in 25% steps. Intraday volatility in this pair is minimal.
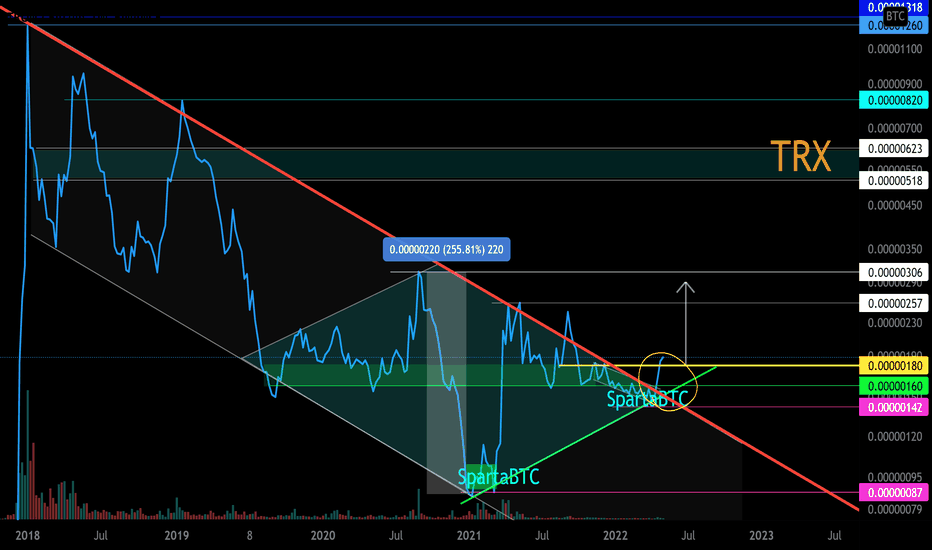
The gray area is this support zone of the channel of the main set of 2019 - 2020 position. This is clearly visible on the line chart on the weekly timeframe.
TRX / BTC Main trend. Linear graph. Trend reversal zones

The price is 2 months in a sideways pattern in 25% steps. Intraday volatility in this pair is minimal.
The gray area is this support zone of the channel of the main set of 2019 - 2020 position. This is clearly visible on the line chart on the weekly timeframe.
TRX / BTC Main trend. Linear graph. Trend reversal zones
Anmerkung
Anmerkung
Anmerkung
Anmerkung

Anmerkung
Anmerkung
Anmerkung

✅ Telegram. Finance + Trading: t.me/+ajtMAB9qbF82ZmJi
✅ Telegram. Сrypto trading only: t.me/+4Bux2Gd8Bo9hNTRi
✅ Instagram: instagram.com/spartabtc_1318
✅ YouTube (Rus): goo.su/vpRzRa2
✅ Telegram. Сrypto trading only: t.me/+4Bux2Gd8Bo9hNTRi
✅ Instagram: instagram.com/spartabtc_1318
✅ YouTube (Rus): goo.su/vpRzRa2
Verbundene Veröffentlichungen
Haftungsausschluss
Die Informationen und Veröffentlichungen sind nicht als Finanz-, Anlage-, Handels- oder andere Arten von Ratschlägen oder Empfehlungen gedacht, die von TradingView bereitgestellt oder gebilligt werden, und stellen diese nicht dar. Lesen Sie mehr in den Nutzungsbedingungen.
✅ Telegram. Finance + Trading: t.me/+ajtMAB9qbF82ZmJi
✅ Telegram. Сrypto trading only: t.me/+4Bux2Gd8Bo9hNTRi
✅ Instagram: instagram.com/spartabtc_1318
✅ YouTube (Rus): goo.su/vpRzRa2
✅ Telegram. Сrypto trading only: t.me/+4Bux2Gd8Bo9hNTRi
✅ Instagram: instagram.com/spartabtc_1318
✅ YouTube (Rus): goo.su/vpRzRa2
Verbundene Veröffentlichungen
Haftungsausschluss
Die Informationen und Veröffentlichungen sind nicht als Finanz-, Anlage-, Handels- oder andere Arten von Ratschlägen oder Empfehlungen gedacht, die von TradingView bereitgestellt oder gebilligt werden, und stellen diese nicht dar. Lesen Sie mehr in den Nutzungsbedingungen.