
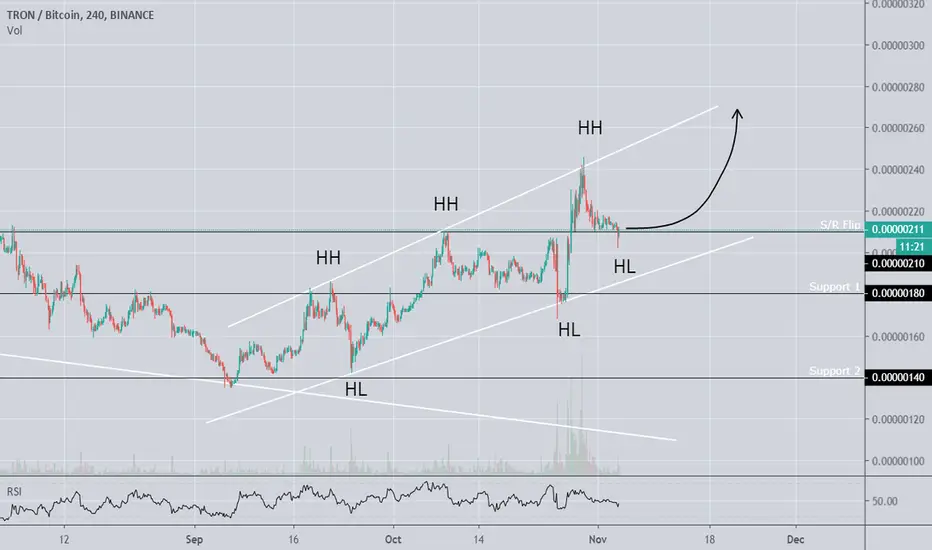
TRX Daily Chart was not inspiring me, so I zoomed in a little (actually, H4 is my favorite configuration, but i prefer trading Daily trends). So here TRX is in a bull trend from start of September. It is making Higher Highs and Higher Lows, printing a Rising Channel.
210 sats has been an important Support / Resistance before, so I'm watching the price action here, and as usual, close below = bearish, close above = bullish.
The next support to long is around 180 sats and the lowest support is at 140 sats but I don't think it will reach that price anymore.
210 sats has been an important Support / Resistance before, so I'm watching the price action here, and as usual, close below = bearish, close above = bullish.
The next support to long is around 180 sats and the lowest support is at 140 sats but I don't think it will reach that price anymore.
Trade ist aktiv
TRX has been holding the S/R flip around 210. Zooming into smaller time frames, we can see that TRX is in an ascending triangle which will likely break out before the end of the week.If you are longing : SL below 210
If you are shorting : SL above 220
[img]
Trade ist aktiv
TRX broke out from its triangle and now retest the patternLong from here to 220 sat
[img]

Haftungsausschluss
Die Informationen und Veröffentlichungen sind nicht als Finanz-, Anlage-, Handels- oder andere Arten von Ratschlägen oder Empfehlungen gedacht, die von TradingView bereitgestellt oder gebilligt werden, und stellen diese nicht dar. Lesen Sie mehr in den Nutzungsbedingungen.
Haftungsausschluss
Die Informationen und Veröffentlichungen sind nicht als Finanz-, Anlage-, Handels- oder andere Arten von Ratschlägen oder Empfehlungen gedacht, die von TradingView bereitgestellt oder gebilligt werden, und stellen diese nicht dar. Lesen Sie mehr in den Nutzungsbedingungen.