
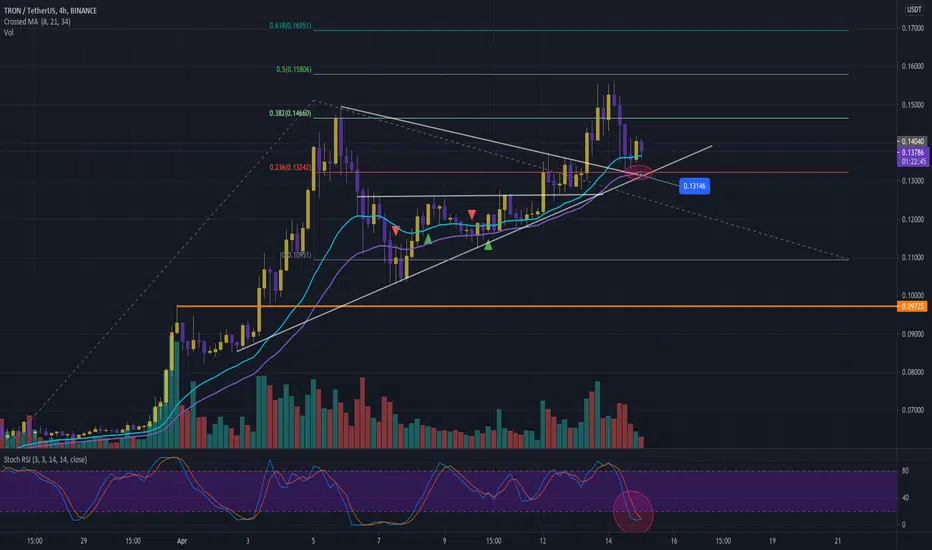
TRX is retesting downtrend which is broken 2 days ago. Everything is going natural. Still there is no close below EMA 21 and EMA8 is going above EMA21 ( green up triangle represents where EMA8 crossed up EMA21) , which means to be direction is still upward. Also 1h RSI is oversold.
A strong support area (red oval circle) has been formed, supported by:
I am still behind my goals in my previous analysis. You can check it from below if you miss it. I think the uptrend will continue in the near future.
If you agree or disagree, you can leave a comment :) . Have a huge profitable days.
(Not a financial advice)
A strong support area (red oval circle) has been formed, supported by:
- EMA 34 (purple line)
- 10-days-long down trend
- 15-days-long up trend
- Fibo-ext 0.236
I am still behind my goals in my previous analysis. You can check it from below if you miss it. I think the uptrend will continue in the near future.
If you agree or disagree, you can leave a comment :) . Have a huge profitable days.
(Not a financial advice)
Anmerkung
Hammer candle formed. Very bullish
Verbundene Veröffentlichungen
Haftungsausschluss
Die Informationen und Veröffentlichungen sind nicht als Finanz-, Anlage-, Handels- oder andere Arten von Ratschlägen oder Empfehlungen gedacht, die von TradingView bereitgestellt oder gebilligt werden, und stellen diese nicht dar. Lesen Sie mehr in den Nutzungsbedingungen.
Verbundene Veröffentlichungen
Haftungsausschluss
Die Informationen und Veröffentlichungen sind nicht als Finanz-, Anlage-, Handels- oder andere Arten von Ratschlägen oder Empfehlungen gedacht, die von TradingView bereitgestellt oder gebilligt werden, und stellen diese nicht dar. Lesen Sie mehr in den Nutzungsbedingungen.