
#TRXUSDT
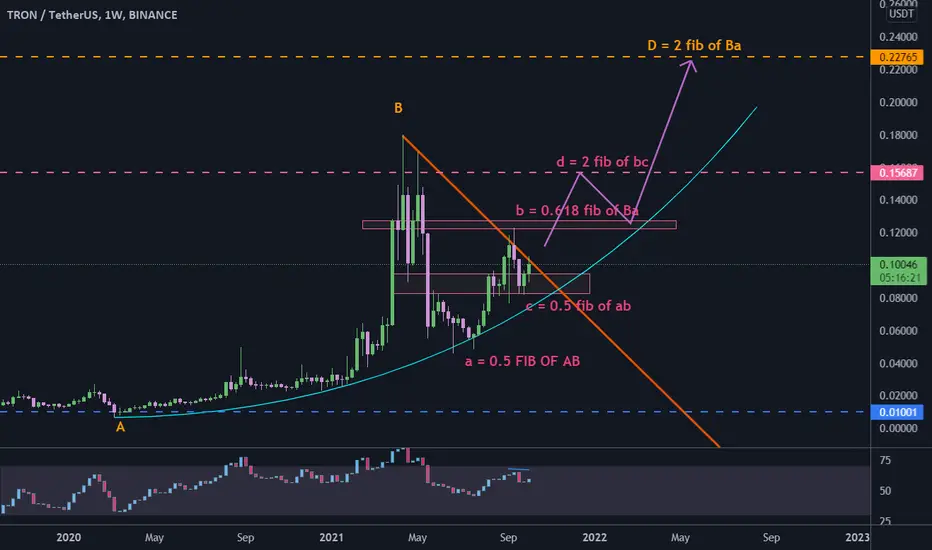
 TRX is trading below a descending resistance line, although price hold above the support zone.
bullish scenario: breaking above the resistance line can lead price upward to touch $0.156 in midterm, and $0.22 in long term as you can see the fib ratios for AB=CD pattern.
bearish scenario: if price break down below support zone, next support is around $0.05 and then $0.01.
TRX is trading below a descending resistance line, although price hold above the support zone.bullish scenario: breaking above the resistance line can lead price upward to touch $0.156 in midterm, and $0.22 in long term as you can see the fib ratios for AB=CD pattern.
bearish scenario: if price break down below support zone, next support is around $0.05 and then $0.01.
Anmerkung
#XTZ/USDT
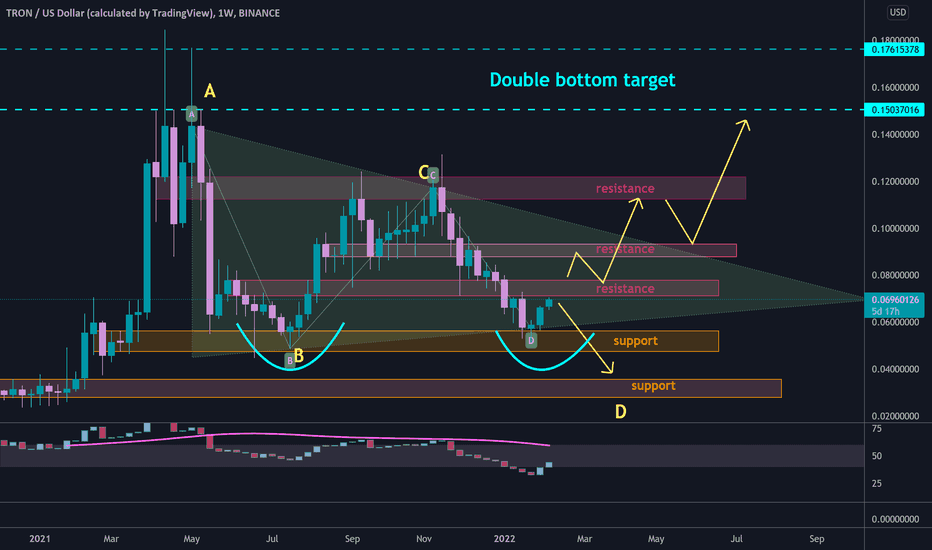
 XTZ rejected from support zone , and reached a resistance zone .
🐮 if price hold the support zone , and break out from resistance zone around $0.077, so it is going up to touch upper line of triangle around resistance zone of $0.09.
🐮🐮 break out from triangle will help price increase more to complete double bottom pattern at $0.15 and $0.176.
🐻 break down from lower line of triangle and support zone , will drop price to complete AB=CD pattern around $0.03

Haftungsausschluss
Die Informationen und Veröffentlichungen sind nicht als Finanz-, Anlage-, Handels- oder andere Arten von Ratschlägen oder Empfehlungen gedacht, die von TradingView bereitgestellt oder gebilligt werden, und stellen diese nicht dar. Lesen Sie mehr in den Nutzungsbedingungen.
Haftungsausschluss
Die Informationen und Veröffentlichungen sind nicht als Finanz-, Anlage-, Handels- oder andere Arten von Ratschlägen oder Empfehlungen gedacht, die von TradingView bereitgestellt oder gebilligt werden, und stellen diese nicht dar. Lesen Sie mehr in den Nutzungsbedingungen.