
What's up Guys , in this analysis I gonna talk about TRX
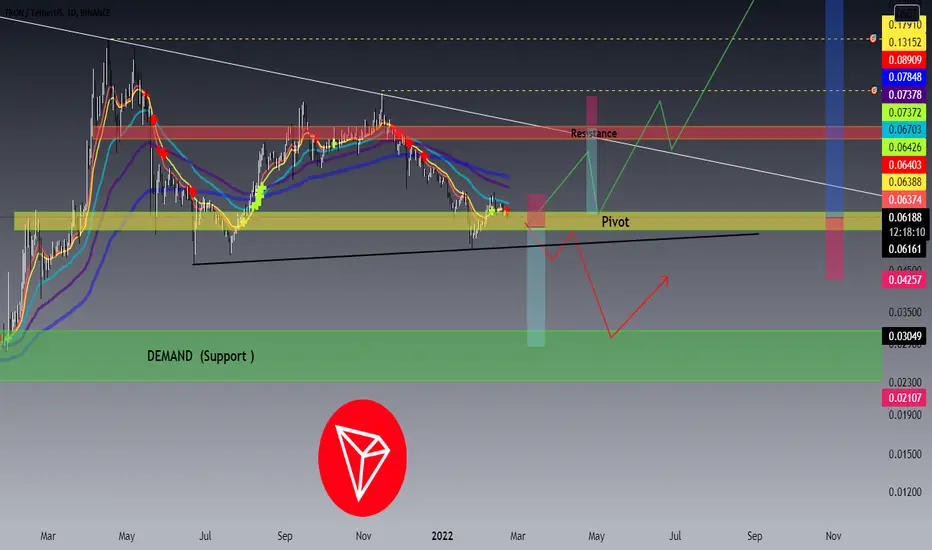
As you can see in the daily and weekly time frame for pair of TRX/USDT ,since 16 April it has been declining after recording new ATH about 0.18$ ,
and now we can see that TRX is compressing in an descending or symmetrical triangle pattern ,
also there is a possibility of further fall right now bcs of crossing under of emas ,
and now It is trading above pivot zone and if break out this current zone in can go down to lower support and Demand area ,
meanwhile it has reached the bottom of triangle again and can have a jump again ,
by breakout of descending trend line , there is a high possibility to reach the targets respectively and seeing new ATH in the long-term .
so in this case it can continue its rally by closing above resistance range and have a pulback and continue .
🛑resistances: $0.099-0.107///descending trendline
🆚pivot zone: $0.057-0.064$
❇️supports: $0.012345-$0.03142 ////ascending trendline
--------------------------------------------------------------------------------------------------------------------
👉This analysis is my personal opinion ,not a financial advice ,so do your own research.
💜 if you're a fan of my analyses PLZ follow me and give a big thumbs 👍 OR drop comment 🗯💭
Anmerkung
trxusdt ( weekly time frame ):
Verbundene Veröffentlichungen
Haftungsausschluss
Die Informationen und Veröffentlichungen sind nicht als Finanz-, Anlage-, Handels- oder andere Arten von Ratschlägen oder Empfehlungen gedacht, die von TradingView bereitgestellt oder gebilligt werden, und stellen diese nicht dar. Lesen Sie mehr in den Nutzungsbedingungen.