
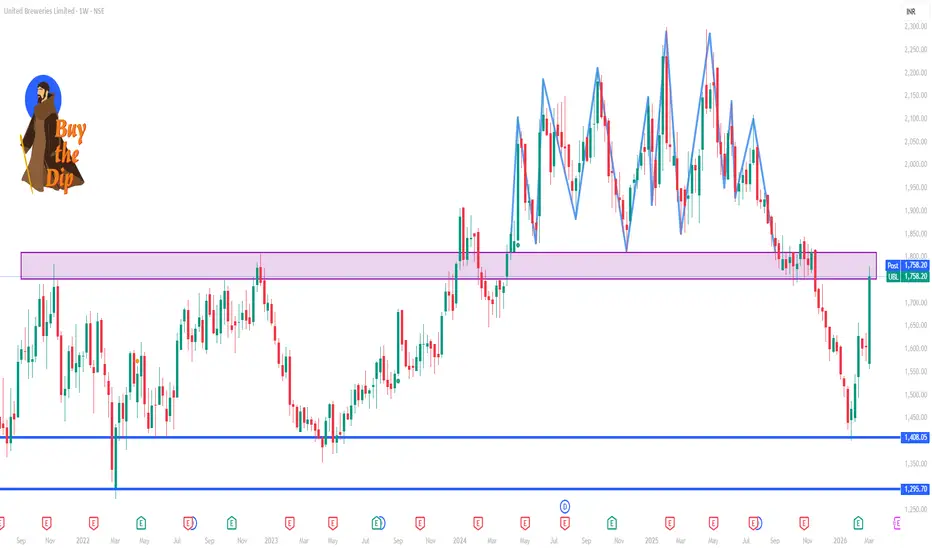
📊 Weekly Levels (Next 1 Week)
Resistance (Upside)
R3: ~₹1,858‑1,860
R2: ~₹1,758‑1,760
R1: ~₹1,693‑1,695
(These are key resistance zones where selling pressure may emerge)
Pivot / Key Reference
Pivot zone: Near mid‑range ~₹1,650‑1,670 (indicative equilibrium)
Support (Downside)
S1: ~₹1,528‑1,530
S2: ~₹1,427‑1,430
S3: ~₹1,360‑1,365
(Below S1 could signal deeper pullbacks)
📌 Weekly Range Projection
Bullish breakout trigger: Weekly close above ~₹1,693‑1,695
Bearish breakdown trigger: Break below ~₹1,528
Expected weekly trading band: ~₹1,360 to ₹1,860 (wide range, high volatility)
🔍 Additional Notes
Weekly pivot calculations vary slightly across tools, but ₹1,690‑1,860 remains the key upside challenge region this week.
On technicals, indicators (e.g., MACD/RSI) show neutral to mixed signals, suggesting no strong trend bias in weekly context.
⚠️ Note: Shares can gap on news and macro events; these levels are technical references, not guaranteed price points.

Contact Knowledgehub for a detailed consultation: Dm on WhatsApp: [wa.link/a2o0kz]-
Phone No: [+91 93102 26243]-
Email: [tradingviewknowledgehub@gmail.com]---
-- Let’s achieve success together!
Phone No: [+91 93102 26243]-
Email: [tradingviewknowledgehub@gmail.com]---
-- Let’s achieve success together!
Verbundene Veröffentlichungen
Haftungsausschluss
Die Informationen und Veröffentlichungen sind nicht als Finanz-, Anlage-, Handels- oder andere Arten von Ratschlägen oder Empfehlungen gedacht, die von TradingView bereitgestellt oder gebilligt werden, und stellen diese nicht dar. Lesen Sie mehr in den Nutzungsbedingungen.