
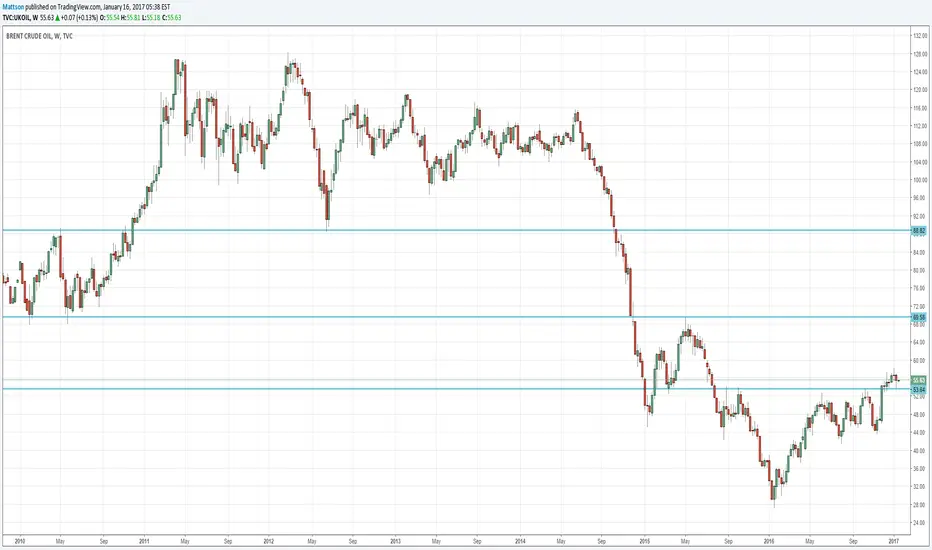
Inverse head and shoulder pettern that broke out in november last year. After it broke out it retested the breakout line and managed to hold it.
Long: above 58,25
S/L: 53,50
TP1: 69,5
TP2: 88
Timeframe 4-5 months
Long: above 58,25
S/L: 53,50
TP1: 69,5
TP2: 88
Timeframe 4-5 months
Anmerkung
It does looks like a head and shoulder pattern is emerging in daily chart, but I think its too small to change the current trend. Neckline break is at 53,50. I will change my strategy for entry if the neckline breaks. Will be looking for an long entry at 50 level if 53,50 breaks.Anmerkung
Oil looks really strong, I will have a buy stop at 58.30 and S/L at 53.50 and aim for 85.
Haftungsausschluss
Die Informationen und Veröffentlichungen sind nicht als Finanz-, Anlage-, Handels- oder andere Arten von Ratschlägen oder Empfehlungen gedacht, die von TradingView bereitgestellt oder gebilligt werden, und stellen diese nicht dar. Lesen Sie mehr in den Nutzungsbedingungen.
Haftungsausschluss
Die Informationen und Veröffentlichungen sind nicht als Finanz-, Anlage-, Handels- oder andere Arten von Ratschlägen oder Empfehlungen gedacht, die von TradingView bereitgestellt oder gebilligt werden, und stellen diese nicht dar. Lesen Sie mehr in den Nutzungsbedingungen.