
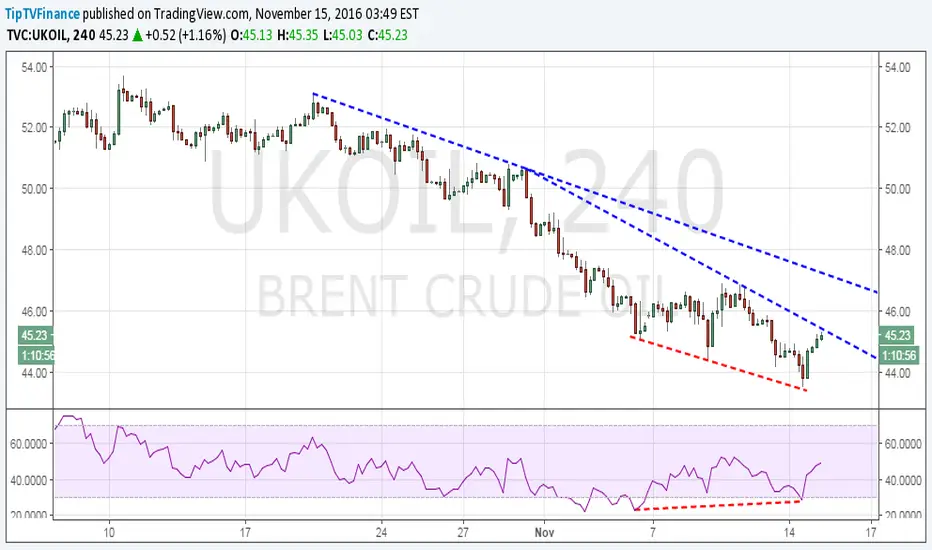
The 4-hour chart shows a bullish price RSI divergence followed by a rise to the descending trend line hurdle.
Oil bulls now await a breach of the trend line hurdle, following which the prices could rise to $46.90 (larger descending trend line hurdle)
On the other hand, a repeated failure to take out trend line hurdle would open doors for a revisit to a recent low of $43.55.
Oil bulls now await a breach of the trend line hurdle, following which the prices could rise to $46.90 (larger descending trend line hurdle)
On the other hand, a repeated failure to take out trend line hurdle would open doors for a revisit to a recent low of $43.55.

Haftungsausschluss
Die Informationen und Veröffentlichungen sind nicht als Finanz-, Anlage-, Handels- oder andere Arten von Ratschlägen oder Empfehlungen gedacht, die von TradingView bereitgestellt oder gebilligt werden, und stellen diese nicht dar. Lesen Sie mehr in den Nutzungsbedingungen.
Haftungsausschluss
Die Informationen und Veröffentlichungen sind nicht als Finanz-, Anlage-, Handels- oder andere Arten von Ratschlägen oder Empfehlungen gedacht, die von TradingView bereitgestellt oder gebilligt werden, und stellen diese nicht dar. Lesen Sie mehr in den Nutzungsbedingungen.