
Sometimes the important part of a breakout isn't the breakout itself...
It's what happens after the breakout.
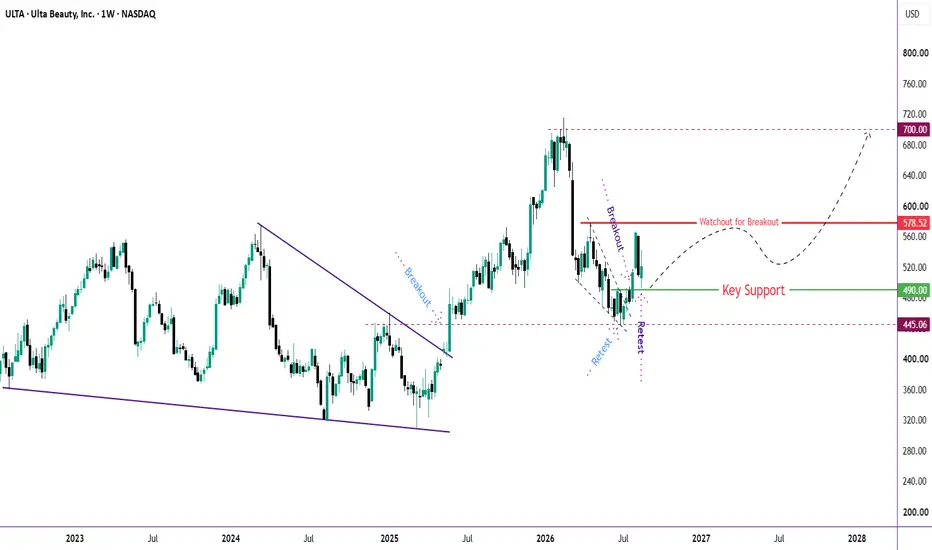
ULTA has been giving us an interesting sequence:
🔹 Broke out of the long-term falling structure
🔹 Ran all the way above $700
🔹 Pulled back sharply
🔹 Returned to $445 — the previous breakout level
🔹 Successfully retested that zone
🔹 Recovered and broke above $490
🔹 Reached $565
🔹 And now pulled back to retest the $490–500 area
And this is where the chart gets interesting. 👀
🧩 The latest candle
The weekly candle has formed a doji around the $495 area, almost exactly where the previous breakout occurred.
That doesn't guarantee a reversal.
But after a pullback into a former resistance-turned-support zone, a doji can indicate that selling pressure is losing momentum and buyers are beginning to defend the level.
So I'm watching the next candle for confirmation.
🎯 Levels I'm watching
🟢 $490–500 — Key support / retest zone
If this area holds:
➡️ $565 — first resistance
➡️ $578 — major resistance
➡️ $700 — previous ATH / major target
And if price eventually clears the ATH with strength...
🚀 Discovery mode begins.
⚠️ What would invalidate the setup?
A sustained move back below the $490 area would weaken the bullish continuation thesis.
And a deeper break below $445 would be much more concerning, because that would mean the previous breakout/retest structure is failing.
🔥 The bigger picture
What I like here is the structure:
Breakout → Deep correction → Retest → Recovery → Breakout → Retest
That's exactly the kind of sequence I want to see in a healthy bullish continuation.
Now the question is:
Was $565 merely the first bounce... or the beginning of the next leg higher?
I'm watching $490–500 very closely.
Hold the retest → reclaim $565 → challenge $578 → ATH back in sight. 👀📈
Not a prediction. The levels are the confirmation points.
It's what happens after the breakout.
ULTA has been giving us an interesting sequence:
🔹 Broke out of the long-term falling structure
🔹 Ran all the way above $700
🔹 Pulled back sharply
🔹 Returned to $445 — the previous breakout level
🔹 Successfully retested that zone
🔹 Recovered and broke above $490
🔹 Reached $565
🔹 And now pulled back to retest the $490–500 area
And this is where the chart gets interesting. 👀
🧩 The latest candle
The weekly candle has formed a doji around the $495 area, almost exactly where the previous breakout occurred.
That doesn't guarantee a reversal.
But after a pullback into a former resistance-turned-support zone, a doji can indicate that selling pressure is losing momentum and buyers are beginning to defend the level.
So I'm watching the next candle for confirmation.
🎯 Levels I'm watching
🟢 $490–500 — Key support / retest zone
If this area holds:
➡️ $565 — first resistance
➡️ $578 — major resistance
➡️ $700 — previous ATH / major target
And if price eventually clears the ATH with strength...
🚀 Discovery mode begins.
⚠️ What would invalidate the setup?
A sustained move back below the $490 area would weaken the bullish continuation thesis.
And a deeper break below $445 would be much more concerning, because that would mean the previous breakout/retest structure is failing.
🔥 The bigger picture
What I like here is the structure:
Breakout → Deep correction → Retest → Recovery → Breakout → Retest
That's exactly the kind of sequence I want to see in a healthy bullish continuation.
Now the question is:
Was $565 merely the first bounce... or the beginning of the next leg higher?
I'm watching $490–500 very closely.
Hold the retest → reclaim $565 → challenge $578 → ATH back in sight. 👀📈
Not a prediction. The levels are the confirmation points.
Trade ist aktiv
Bounced from support, moving as expected, reaching the breakout level again.
📊 Charts → 🏗️ Structure → 🎯 Probability =📖 Chart Story
⏳ Patience → 🚀Success
🎯 If this setup makes sense to you, show it some support with a Boost.
⏳ Patience → 🚀Success
🎯 If this setup makes sense to you, show it some support with a Boost.
Haftungsausschluss
Die Informationen und Veröffentlichungen sind nicht als Finanz-, Anlage-, Handels- oder andere Arten von Ratschlägen oder Empfehlungen gedacht, die von TradingView bereitgestellt oder gebilligt werden, und stellen diese nicht dar. Lesen Sie mehr in den Nutzungsbedingungen.
📊 Charts → 🏗️ Structure → 🎯 Probability =📖 Chart Story
⏳ Patience → 🚀Success
🎯 If this setup makes sense to you, show it some support with a Boost.
⏳ Patience → 🚀Success
🎯 If this setup makes sense to you, show it some support with a Boost.
Haftungsausschluss
Die Informationen und Veröffentlichungen sind nicht als Finanz-, Anlage-, Handels- oder andere Arten von Ratschlägen oder Empfehlungen gedacht, die von TradingView bereitgestellt oder gebilligt werden, und stellen diese nicht dar. Lesen Sie mehr in den Nutzungsbedingungen.