
The 10 year Treasury yield is back trading at levels last seen right before the Great Financial Crisis, and that alone is enough to make people pay attention. Back then, a sustained move higher in yields was one of the signals flashing before everything unraveled in 2008. Since expectations are now weighing toward the Fed holding rates higher for longer, how yields move from this point forward will continue to ripple through the entire economy. Let's take a look at what the chart is saying.
The Breakout
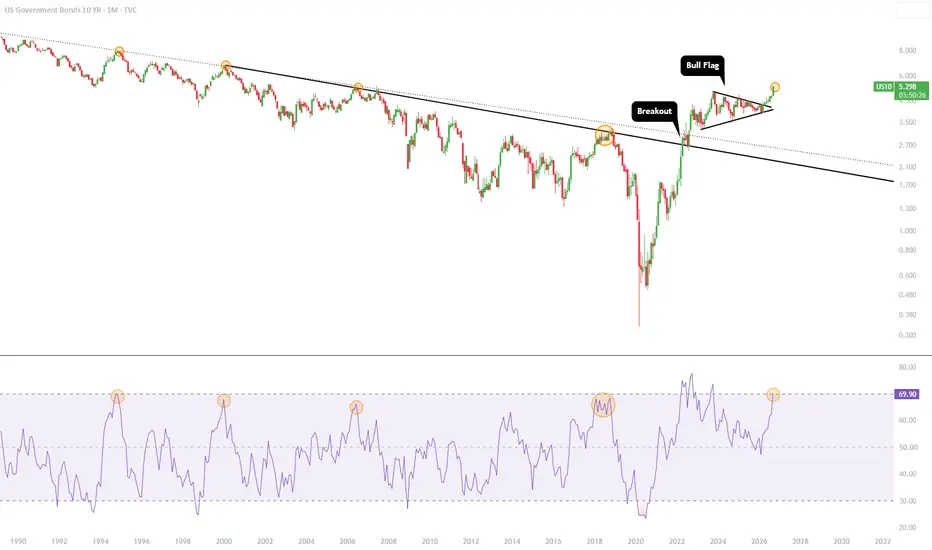
The first thing to note is the breakout that occurred in 2022, and it continues to prove itself. This came off a nearly 35 year break above the downward resistance trendline dating back to 1987 (dotted black trendline). Even looking at it purely as a breakout above the solid black trendline, yields broke out, retested the trendline as new support, and then shot higher.
The Bull Flag
What is also interesting is that the 10yr yield formed a bull flag on the monthly timeframe from mid 2023 through the recent breakout that occurred in April. Since that bull flag breakout, the 10 year yield has already risen roughly 23% over the past 6 months, and based on standard technical measured move calculations, this breakout could still point meaningfully higher.
The Monthly RSI Warning
However, the monthly RSI deserves close attention right now. Historically, when the monthly RSI pushed above 65 but failed to close above 70, it marked a significant top for the 10 year yield. I have outlined this with orange circles, both on the RSI and on ytm at those same moments.
This occurred in November 1994, with the monthly RSI topping at 69.89. It happened again in January 2000 at 67.87. Again in June 2006 at 66.06. There were a few additional monthly tops between 66 and 68 before the final example in October 2018 at 68.2. Once again, it looks like the monthly RSI is closing right below the 70, which could set up a top on both the RSI and yields themselves, potentially leading to a red October for the 10 year yield.
Why This Time Might Be Different
That said, this time may actually play out differently. Since the 2022 breakout above the multi decade trendline, every time the monthly RSI has extended past 70, yields have continued rising rather than topping out. I have outlined the three most recent examples of this on the chart here:

From both a fundamental and technical perspective, it will be extremely important to watch what the US Treasury does in early October. Both the yield itself and the monthly RSI are sitting at genuinely critical levels right now.
This also matters well beyond bonds themselves. Rising yields directly pressure non yield bearing assets since it would mean giving up the now higher return available from safer, interest bearing alternatives like Treasuries.
I just wanted to outline what I currently see within the charts so keep a close eye on how the RSI interacts with this key overbought range in the weeks ahead.
The Breakout
The first thing to note is the breakout that occurred in 2022, and it continues to prove itself. This came off a nearly 35 year break above the downward resistance trendline dating back to 1987 (dotted black trendline). Even looking at it purely as a breakout above the solid black trendline, yields broke out, retested the trendline as new support, and then shot higher.
The Bull Flag
What is also interesting is that the 10yr yield formed a bull flag on the monthly timeframe from mid 2023 through the recent breakout that occurred in April. Since that bull flag breakout, the 10 year yield has already risen roughly 23% over the past 6 months, and based on standard technical measured move calculations, this breakout could still point meaningfully higher.
The Monthly RSI Warning
However, the monthly RSI deserves close attention right now. Historically, when the monthly RSI pushed above 65 but failed to close above 70, it marked a significant top for the 10 year yield. I have outlined this with orange circles, both on the RSI and on ytm at those same moments.
This occurred in November 1994, with the monthly RSI topping at 69.89. It happened again in January 2000 at 67.87. Again in June 2006 at 66.06. There were a few additional monthly tops between 66 and 68 before the final example in October 2018 at 68.2. Once again, it looks like the monthly RSI is closing right below the 70, which could set up a top on both the RSI and yields themselves, potentially leading to a red October for the 10 year yield.
Why This Time Might Be Different
That said, this time may actually play out differently. Since the 2022 breakout above the multi decade trendline, every time the monthly RSI has extended past 70, yields have continued rising rather than topping out. I have outlined the three most recent examples of this on the chart here:
From both a fundamental and technical perspective, it will be extremely important to watch what the US Treasury does in early October. Both the yield itself and the monthly RSI are sitting at genuinely critical levels right now.
This also matters well beyond bonds themselves. Rising yields directly pressure non yield bearing assets since it would mean giving up the now higher return available from safer, interest bearing alternatives like Treasuries.
I just wanted to outline what I currently see within the charts so keep a close eye on how the RSI interacts with this key overbought range in the weeks ahead.

Haftungsausschluss
Die Informationen und Veröffentlichungen sind nicht als Finanz-, Anlage-, Handels- oder andere Arten von Ratschlägen oder Empfehlungen gedacht, die von TradingView bereitgestellt oder gebilligt werden, und stellen diese nicht dar. Lesen Sie mehr in den Nutzungsbedingungen.
Haftungsausschluss
Die Informationen und Veröffentlichungen sind nicht als Finanz-, Anlage-, Handels- oder andere Arten von Ratschlägen oder Empfehlungen gedacht, die von TradingView bereitgestellt oder gebilligt werden, und stellen diese nicht dar. Lesen Sie mehr in den Nutzungsbedingungen.