US100 - DAILY
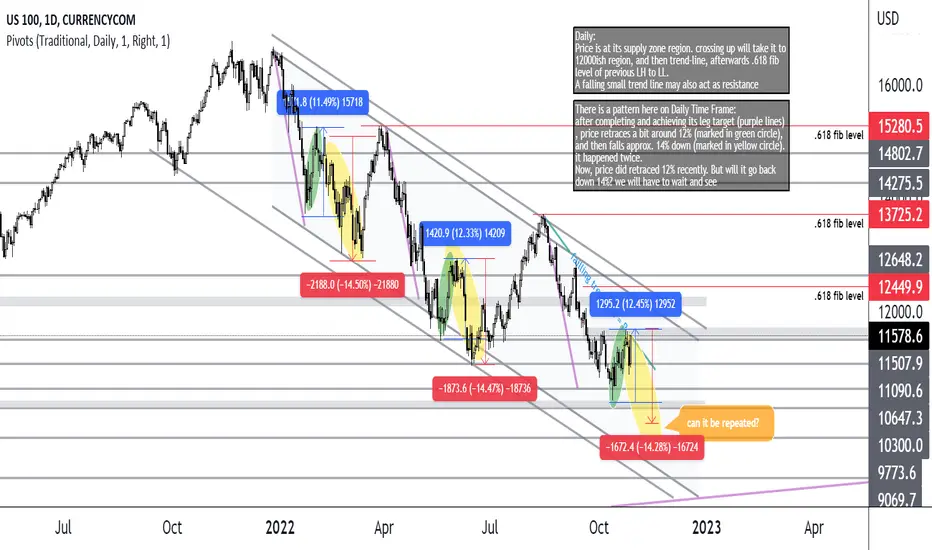
Daily: Price is at its supply zone region. crossing up will take it to 12000ish region, and then trend-line, afterwards .618 fib level of previous LH to LL. A falling small trend line may also act as resistance.
There is a pattern here on Daily Time Frame: after completing and achieving its leg target (purple lines), price retraces a bit around 12% (marked in green circle), and then falls approx. 14% down (marked in yellow circle). it happened twice. Now, price did retraced 12% recently. But will it go back down 14%? we will have to wait and see
There is a pattern here on Daily Time Frame: after completing and achieving its leg target (purple lines), price retraces a bit around 12% (marked in green circle), and then falls approx. 14% down (marked in yellow circle). it happened twice. Now, price did retraced 12% recently. But will it go back down 14%? we will have to wait and see

Haftungsausschluss
Die Informationen und Veröffentlichungen sind nicht als Finanz-, Anlage-, Handels- oder andere Arten von Ratschlägen oder Empfehlungen gedacht, die von TradingView bereitgestellt oder gebilligt werden, und stellen diese nicht dar. Lesen Sie mehr in den Nutzungsbedingungen.
Haftungsausschluss
Die Informationen und Veröffentlichungen sind nicht als Finanz-, Anlage-, Handels- oder andere Arten von Ratschlägen oder Empfehlungen gedacht, die von TradingView bereitgestellt oder gebilligt werden, und stellen diese nicht dar. Lesen Sie mehr in den Nutzungsbedingungen.