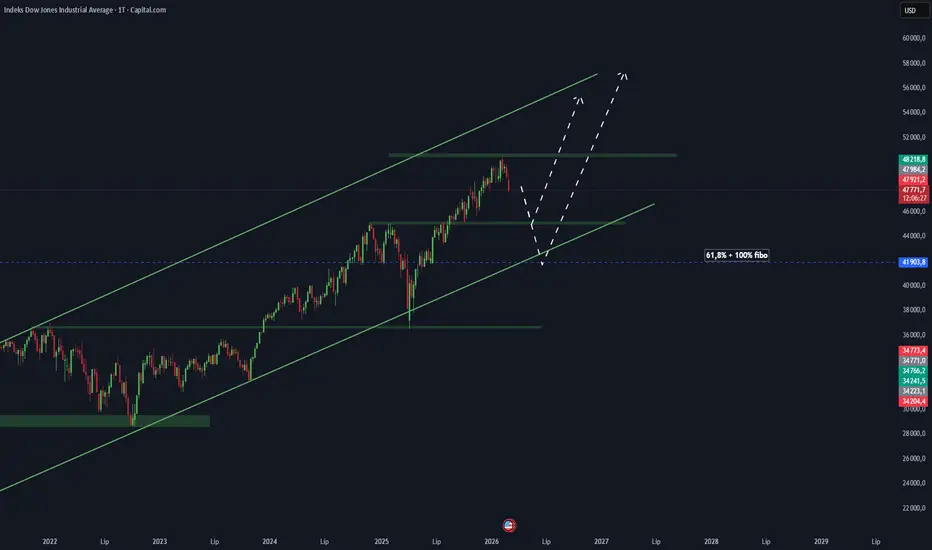
The Dow Jones Industrial Average (DJ30) remains in a long-term uptrend. Since 2023 the index has been moving inside an ascending channel, consistently forming higher highs and higher lows.
At the moment, price has reached a strong resistance zone around 50,000, where sellers have started to react and the market is showing signs of a short-term pullback.
📉 Potential scenario:
• pullback toward the nearest support zone around 45k–46k
• possible deeper correction toward ~41.9k (61.8% Fibonacci), which also aligns with the lower trendline of the ascending channel
📈 If one of these support areas holds, the base scenario remains:
correction → higher low → continuation of the uptrend, US30 with a potential breakout above 50k.
For now, this looks more like a healthy correction within an ongoing uptrend, rather than a trend reversal.
At the moment, price has reached a strong resistance zone around 50,000, where sellers have started to react and the market is showing signs of a short-term pullback.
📉 Potential scenario:
• pullback toward the nearest support zone around 45k–46k
• possible deeper correction toward ~41.9k (61.8% Fibonacci), which also aligns with the lower trendline of the ascending channel
📈 If one of these support areas holds, the base scenario remains:
correction → higher low → continuation of the uptrend,
US30 with a potential breakout above 50k.For now, this looks more like a healthy correction within an ongoing uptrend, rather than a trend reversal.

Haftungsausschluss
Die Informationen und Veröffentlichungen sind nicht als Finanz-, Anlage-, Handels- oder andere Arten von Ratschlägen oder Empfehlungen gedacht, die von TradingView bereitgestellt oder gebilligt werden, und stellen diese nicht dar. Lesen Sie mehr in den Nutzungsbedingungen.
Haftungsausschluss
Die Informationen und Veröffentlichungen sind nicht als Finanz-, Anlage-, Handels- oder andere Arten von Ratschlägen oder Empfehlungen gedacht, die von TradingView bereitgestellt oder gebilligt werden, und stellen diese nicht dar. Lesen Sie mehr in den Nutzungsbedingungen.