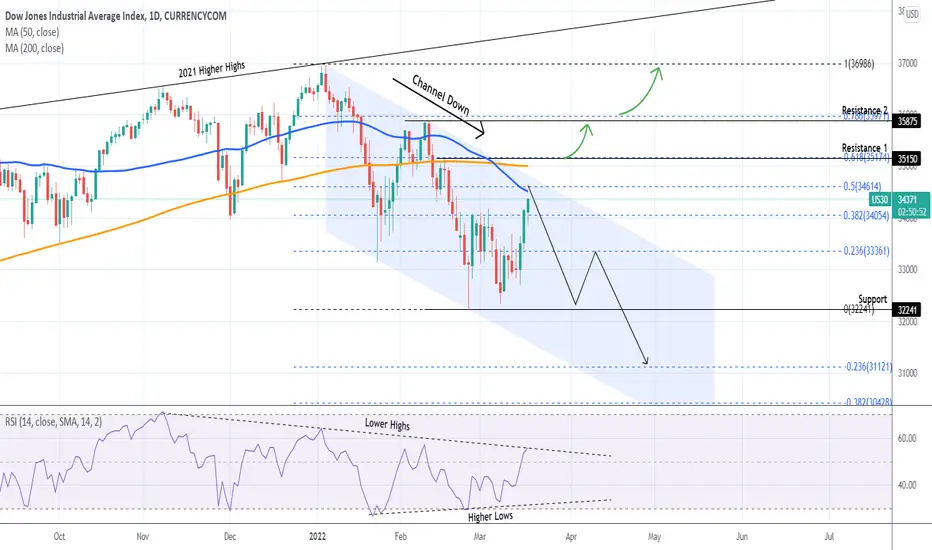
DOW JONES testing the top of its Channel and 1D MA50
My last Dow Jones update on the 1D time-frame was on a fractal comparison between the Ukraine - Russia war and the 2018/19 U.S. - Chine trade war:
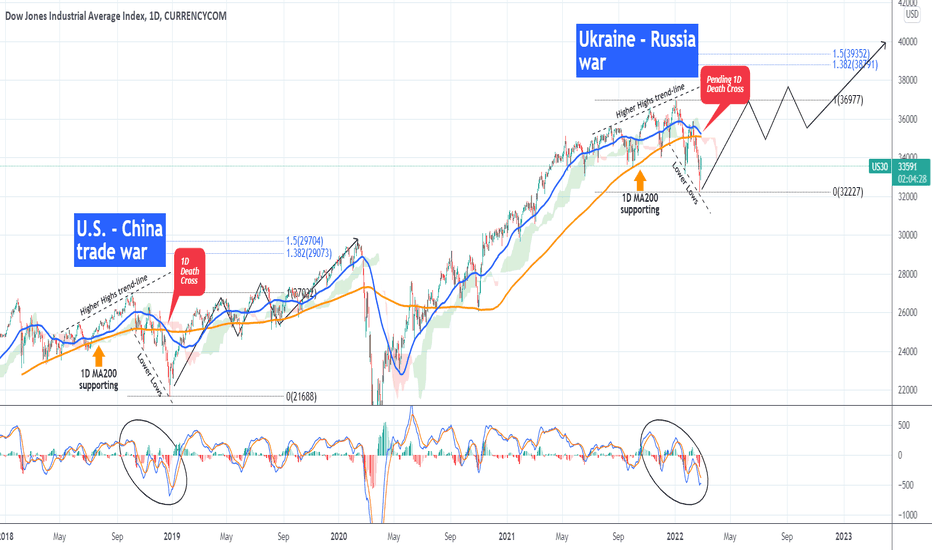
So far it looks like the fractal works out quite well and may have a potential bottom. However as the index has come its closest to the 1D MA50 (blue trend-line) since February 10, it is time to look into today in more detail, as a rejection may invalidate the bullish case.
As the chart shows, the dominant pattern is a Channel Down, meaning that the sentiment remains bearish. If the price gets rejected somewhere within the Resistance of the 1D MA50 and the top of the Channel Down (its Lower Highs trend-line), then most likely we will revisit the 32240 Support and potentially even a Lower Low on the -0.236 Fibonacci extension.
The 1D MA200 (orange trend-line) is also a Resistance, having a rejection on February 16. Practically, a clear buy is only a break above the 35150 Resistance (1), which will set in motion a test of the 35875 Resistance (2). See how those two Resistance levels match exactly the 0.618 and 0.786 Fibonacci retracement levels respectively.
At this point we have to mention that the 1D RSI is about to break its Lower Highs since November, giving an extra edge to the bullish case. Also note that the RSI is showing a hidden Bullish Divergence as it has been on Higher Lows since January 21 as opposed to the Lower Lows of the price action.
--------------------------------------------------------------------------------------------------------
** Please support this idea with your likes and comments, it is the best way to keep it relevant and support me. **
--------------------------------------------------------------------------------------------------------
So far it looks like the fractal works out quite well and may have a potential bottom. However as the index has come its closest to the 1D MA50 (blue trend-line) since February 10, it is time to look into today in more detail, as a rejection may invalidate the bullish case.
As the chart shows, the dominant pattern is a Channel Down, meaning that the sentiment remains bearish. If the price gets rejected somewhere within the Resistance of the 1D MA50 and the top of the Channel Down (its Lower Highs trend-line), then most likely we will revisit the 32240 Support and potentially even a Lower Low on the -0.236 Fibonacci extension.
The 1D MA200 (orange trend-line) is also a Resistance, having a rejection on February 16. Practically, a clear buy is only a break above the 35150 Resistance (1), which will set in motion a test of the 35875 Resistance (2). See how those two Resistance levels match exactly the 0.618 and 0.786 Fibonacci retracement levels respectively.
At this point we have to mention that the 1D RSI is about to break its Lower Highs since November, giving an extra edge to the bullish case. Also note that the RSI is showing a hidden Bullish Divergence as it has been on Higher Lows since January 21 as opposed to the Lower Lows of the price action.
--------------------------------------------------------------------------------------------------------
** Please support this idea with your likes and comments, it is the best way to keep it relevant and support me. **
--------------------------------------------------------------------------------------------------------

I trade Crypto, Forex, Indices & Commodities on PrimeXBT — all from one account with TradingView charts 👉 tradingshot.short.gy/PrimeXBT
I also use TradeNation for fixed spreads & zero commission 👉 tradingshot.short.gy/Tradenation
I also use TradeNation for fixed spreads & zero commission 👉 tradingshot.short.gy/Tradenation
Haftungsausschluss
Die Informationen und Veröffentlichungen sind nicht als Finanz-, Anlage-, Handels- oder andere Arten von Ratschlägen oder Empfehlungen gedacht, die von TradingView bereitgestellt oder gebilligt werden, und stellen diese nicht dar. Lesen Sie mehr in den Nutzungsbedingungen.
I trade Crypto, Forex, Indices & Commodities on PrimeXBT — all from one account with TradingView charts 👉 tradingshot.short.gy/PrimeXBT
I also use TradeNation for fixed spreads & zero commission 👉 tradingshot.short.gy/Tradenation
I also use TradeNation for fixed spreads & zero commission 👉 tradingshot.short.gy/Tradenation
Haftungsausschluss
Die Informationen und Veröffentlichungen sind nicht als Finanz-, Anlage-, Handels- oder andere Arten von Ratschlägen oder Empfehlungen gedacht, die von TradingView bereitgestellt oder gebilligt werden, und stellen diese nicht dar. Lesen Sie mehr in den Nutzungsbedingungen.