
SYMBOL: TVC:US30Y | DIRECTION: YIELD HIGHER | TIMEFRAME: 1-Month
Published: July 2026
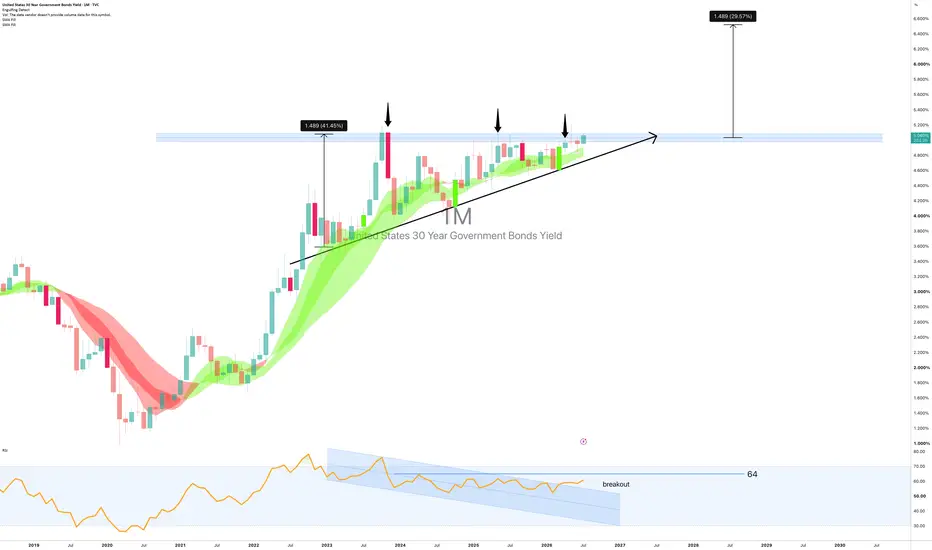
Three times the 30-year yield approached the 5.0-5.2% resistance band. Three times it was turned back. Three times the subsequent pullback was shallower than the one before it. A market that keeps returning to a level with less and less willingness to retreat from it is not a market that wants to go lower. It is a market building pressure for a move through.
Note: this idea is long the yield. Higher yield = lower bond price. Position accordingly.
On the above monthly chart the 30-year US Treasury yield is about to break out of a multi-year ascending triangle. Several reasons now exist to expect further upside in yield. They include:
1) Ascending triangle: textbook geometry. Horizontal resistance at 5.0–5.2% tested in 2023, early 2025, and mid-2026, each marked by a downward arrow on the chart. Each rejection produced a higher low than the last, creating the rising diagonal support line that defines the pattern. The measured move from the breakout projects a further +1.489 percentage points, or 29.57%, targeting a yield of approximately 6.5%. That is the mathematics of the pattern. The chart is doing the work.
2) The trend channel confirms the structure. The Gaussian channel has tracked this entire advance from the 2020 lows without interruption. Price is above it. The channel is rising beneath it. This is not a structure that is turning down. It is one that has absorbed three tests of resistance and remains pointed upward.

3) The macro case has not gone away. US debt issuance is at a structural high. The term premium is the extra yield investors demand for lending long. It has been repricing upward for three years. When a government needs to borrow more and buyers demand more to lend, the direction of long yields is not a mystery. The chart and the macro are saying the same thing.
One caveat worth acknowledging
RSI has been operating within a descending channel since the 2022 yield peak, making lower highs each time yield retests 5.0%+. That is bearish divergence and it deserves respect. It has not prevented the ascending triangle from forming, and it has not prevented the resistance breakout. But if RSI continues to decline as yield pushes toward 6.5%, that divergence will eventually have something to say about it. Watch the RSI channel. A breakout above it removes the concern. A continued decline raises it. A break above 64 will result in a melt up for markets and a melt down for precious metals.
Forecasts (yield)
1st target: 5.5%. Prior reaction zone within the advance.
2nd target: 6.489%. The ascending triangle measured move. A monthly close back below the ascending support line, currently near 4.6% and rising, cancels the thesis.
The crowd
The consensus has been calling for lower long yields, and therefore a bond rally, for the better part of three years. The Fed will cut. Inflation will moderate. The long end will recover. Three tests of resistance and three higher lows later, the yield has not cooperated. The bond market is considerably larger and considerably less sentimental than anyone forecasting it. It is not interested in what the consensus thinks should happen. The ascending triangle is what is happening as most publishers on tradingview go short. Bless.
Is it possible the breakout fails, yield retreats and the long bond finally gets its recovery? Of course. The RSI divergence exists for a reason.
Is it probable, with an ascending triangle, three years of higher lows, a rising trend channel, and a macro backdrop that has not solved the debt question? Look left. Look at the diagonal. Is this time different?
What should I do with this information? Boring Bond markets don't apply to me!
Got debt? In 10-12 month you'll wish you hadn't. Pay it off as quickly as possible.
Ww
Type: Macro / yield direction | Timeframe: 12–24 months
======================================================
Disclaimer: This idea is for educational and informational purposes only. It is not financial advice. Government bond yields and fixed income markets involve significant risk. Higher yields imply lower bond prices and potential capital loss for existing holders. Always do your own research and consult a qualified financial adviser before making any investment decisions. Past performance is not indicative of future results.
Published: July 2026
Three times the 30-year yield approached the 5.0-5.2% resistance band. Three times it was turned back. Three times the subsequent pullback was shallower than the one before it. A market that keeps returning to a level with less and less willingness to retreat from it is not a market that wants to go lower. It is a market building pressure for a move through.
Note: this idea is long the yield. Higher yield = lower bond price. Position accordingly.
On the above monthly chart the 30-year US Treasury yield is about to break out of a multi-year ascending triangle. Several reasons now exist to expect further upside in yield. They include:
1) Ascending triangle: textbook geometry. Horizontal resistance at 5.0–5.2% tested in 2023, early 2025, and mid-2026, each marked by a downward arrow on the chart. Each rejection produced a higher low than the last, creating the rising diagonal support line that defines the pattern. The measured move from the breakout projects a further +1.489 percentage points, or 29.57%, targeting a yield of approximately 6.5%. That is the mathematics of the pattern. The chart is doing the work.
2) The trend channel confirms the structure. The Gaussian channel has tracked this entire advance from the 2020 lows without interruption. Price is above it. The channel is rising beneath it. This is not a structure that is turning down. It is one that has absorbed three tests of resistance and remains pointed upward.
3) The macro case has not gone away. US debt issuance is at a structural high. The term premium is the extra yield investors demand for lending long. It has been repricing upward for three years. When a government needs to borrow more and buyers demand more to lend, the direction of long yields is not a mystery. The chart and the macro are saying the same thing.
One caveat worth acknowledging
RSI has been operating within a descending channel since the 2022 yield peak, making lower highs each time yield retests 5.0%+. That is bearish divergence and it deserves respect. It has not prevented the ascending triangle from forming, and it has not prevented the resistance breakout. But if RSI continues to decline as yield pushes toward 6.5%, that divergence will eventually have something to say about it. Watch the RSI channel. A breakout above it removes the concern. A continued decline raises it. A break above 64 will result in a melt up for markets and a melt down for precious metals.
Forecasts (yield)
1st target: 5.5%. Prior reaction zone within the advance.
2nd target: 6.489%. The ascending triangle measured move. A monthly close back below the ascending support line, currently near 4.6% and rising, cancels the thesis.
The crowd
The consensus has been calling for lower long yields, and therefore a bond rally, for the better part of three years. The Fed will cut. Inflation will moderate. The long end will recover. Three tests of resistance and three higher lows later, the yield has not cooperated. The bond market is considerably larger and considerably less sentimental than anyone forecasting it. It is not interested in what the consensus thinks should happen. The ascending triangle is what is happening as most publishers on tradingview go short. Bless.
Is it possible the breakout fails, yield retreats and the long bond finally gets its recovery? Of course. The RSI divergence exists for a reason.
Is it probable, with an ascending triangle, three years of higher lows, a rising trend channel, and a macro backdrop that has not solved the debt question? Look left. Look at the diagonal. Is this time different?
What should I do with this information? Boring Bond markets don't apply to me!
Got debt? In 10-12 month you'll wish you hadn't. Pay it off as quickly as possible.
Ww
Type: Macro / yield direction | Timeframe: 12–24 months
======================================================
Disclaimer: This idea is for educational and informational purposes only. It is not financial advice. Government bond yields and fixed income markets involve significant risk. Higher yields imply lower bond prices and potential capital loss for existing holders. Always do your own research and consult a qualified financial adviser before making any investment decisions. Past performance is not indicative of future results.
Trade ist aktiv
Past resistance confirms support.The possibility of interest rate cuts takes another blow.. seems the rest of the world does not wish to lend to Uncle Sam.

Haftungsausschluss
Die Informationen und Veröffentlichungen sind nicht als Finanz-, Anlage-, Handels- oder andere Arten von Ratschlägen oder Empfehlungen gedacht, die von TradingView bereitgestellt oder gebilligt werden, und stellen diese nicht dar. Lesen Sie mehr in den Nutzungsbedingungen.
Haftungsausschluss
Die Informationen und Veröffentlichungen sind nicht als Finanz-, Anlage-, Handels- oder andere Arten von Ratschlägen oder Empfehlungen gedacht, die von TradingView bereitgestellt oder gebilligt werden, und stellen diese nicht dar. Lesen Sie mehr in den Nutzungsbedingungen.