Uncertain S&P 500
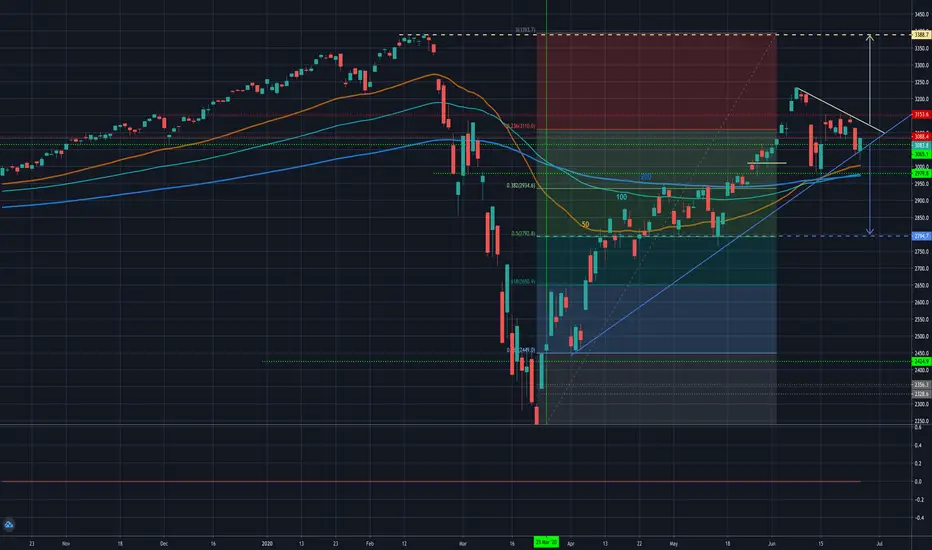
On my chart, you can see the triangle in which the price moves, the lower border of the triangle is indicated by blue colors and when it breaks down it can lead to a further drop in the price. And there is also the upper border of the triangle marked in yellow and when it is broken up, it will be a signal of further restoration of the market up to the previous maximum prices

Haftungsausschluss
Die Informationen und Veröffentlichungen sind nicht als Finanz-, Anlage-, Handels- oder andere Arten von Ratschlägen oder Empfehlungen gedacht, die von TradingView bereitgestellt oder gebilligt werden, und stellen diese nicht dar. Lesen Sie mehr in den Nutzungsbedingungen.
Haftungsausschluss
Die Informationen und Veröffentlichungen sind nicht als Finanz-, Anlage-, Handels- oder andere Arten von Ratschlägen oder Empfehlungen gedacht, die von TradingView bereitgestellt oder gebilligt werden, und stellen diese nicht dar. Lesen Sie mehr in den Nutzungsbedingungen.