

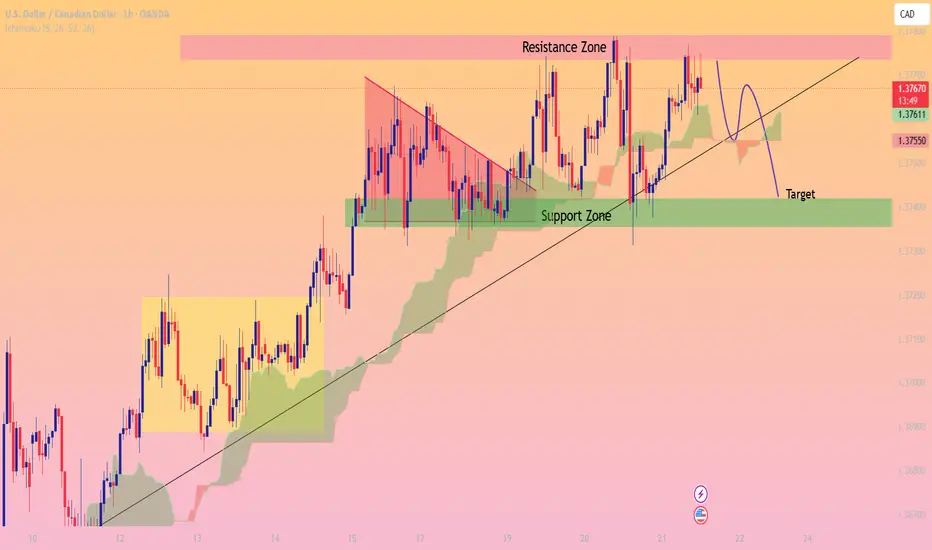
This 1-hour USD/CAD chart highlights a strong bullish trend that has been gradually climbing along a well-respected ascending trendline. Price action remains structurally bullish overall, supported by higher lows and sustained positioning above the Ichimoku cloud for most of the move.
Earlier in the chart, the market consolidated inside a range before breaking upward and transitioning into a stronger bullish phase. Following the breakout, price formed a temporary bearish corrective structure (descending wedge/flag), shown in red, which eventually resolved to the upside and continued the prevailing uptrend.
The pair has now reached a major resistance zone around **1.3775 – 1.3780**, where price has repeatedly faced rejection. Multiple failed breakout attempts and long upper wicks indicate strong seller activity at this level. Momentum appears to be slowing as buyers struggle to sustain a move above resistance.
The chart also shows price extending away from the ascending trendline and the Ichimoku support base, increasing the probability of a short-term retracement before any further bullish continuation.
### Key Technical Observations
* **Market Structure:** Bullish overall, corrective bearish short term
* **Trendline:** Ascending support remains intact
* **Resistance Zone:** 1.3775 – 1.3780
* **Dynamic Support:** Ichimoku cloud and rising trendline
* **Current Bias:** Potential pullback from resistance
### Target
The projected downside target is the highlighted green support zone near:
* **Target Area:** **1.3740 – 1.3738**
This target aligns with:
* Previous support and consolidation base,
* Ichimoku cloud support region,
* Rising trendline interaction area,
* Potential liquidity retracement zone before continuation.
### Outlook
As long as USD/CAD remains below the resistance zone, the chart favors a corrective move lower toward support. A successful reaction from the target zone could later provide buyers with another opportunity to resume the broader uptrend.
Earlier in the chart, the market consolidated inside a range before breaking upward and transitioning into a stronger bullish phase. Following the breakout, price formed a temporary bearish corrective structure (descending wedge/flag), shown in red, which eventually resolved to the upside and continued the prevailing uptrend.
The pair has now reached a major resistance zone around **1.3775 – 1.3780**, where price has repeatedly faced rejection. Multiple failed breakout attempts and long upper wicks indicate strong seller activity at this level. Momentum appears to be slowing as buyers struggle to sustain a move above resistance.
The chart also shows price extending away from the ascending trendline and the Ichimoku support base, increasing the probability of a short-term retracement before any further bullish continuation.
### Key Technical Observations
* **Market Structure:** Bullish overall, corrective bearish short term
* **Trendline:** Ascending support remains intact
* **Resistance Zone:** 1.3775 – 1.3780
* **Dynamic Support:** Ichimoku cloud and rising trendline
* **Current Bias:** Potential pullback from resistance
### Target
The projected downside target is the highlighted green support zone near:
* **Target Area:** **1.3740 – 1.3738**
This target aligns with:
* Previous support and consolidation base,
* Ichimoku cloud support region,
* Rising trendline interaction area,
* Potential liquidity retracement zone before continuation.
### Outlook
As long as USD/CAD remains below the resistance zone, the chart favors a corrective move lower toward support. A successful reaction from the target zone could later provide buyers with another opportunity to resume the broader uptrend.
Trade ist aktiv
Active 
join this channel for free signals
t.me/+EM2OGkUHG5g5MjA0
join this for trading education purpose
t.me/+EM2OGkUHG5g5MjA0
t.me/+EM2OGkUHG5g5MjA0
join this for trading education purpose
t.me/+EM2OGkUHG5g5MjA0
Verbundene Veröffentlichungen
Haftungsausschluss
Die Informationen und Veröffentlichungen sind nicht als Finanz-, Anlage-, Handels- oder andere Arten von Ratschlägen oder Empfehlungen gedacht, die von TradingView bereitgestellt oder gebilligt werden, und stellen diese nicht dar. Lesen Sie mehr in den Nutzungsbedingungen.
join this channel for free signals
t.me/+EM2OGkUHG5g5MjA0
join this for trading education purpose
t.me/+EM2OGkUHG5g5MjA0
t.me/+EM2OGkUHG5g5MjA0
join this for trading education purpose
t.me/+EM2OGkUHG5g5MjA0
Verbundene Veröffentlichungen
Haftungsausschluss
Die Informationen und Veröffentlichungen sind nicht als Finanz-, Anlage-, Handels- oder andere Arten von Ratschlägen oder Empfehlungen gedacht, die von TradingView bereitgestellt oder gebilligt werden, und stellen diese nicht dar. Lesen Sie mehr in den Nutzungsbedingungen.