

SMC Trading point update
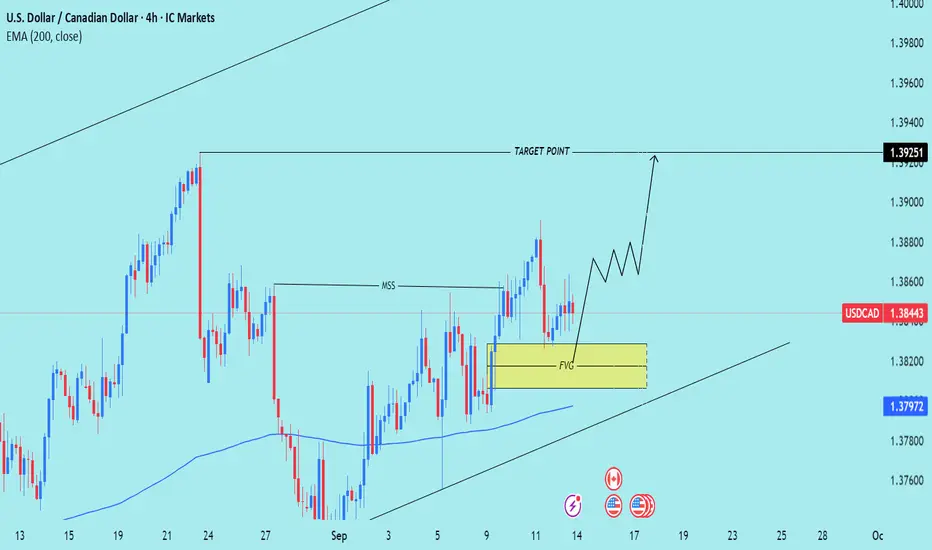
Technical analysis of USD/CAD in the 4H timeframe. Here’s the behind the analysis:
---
Key Technical Points:
1. FVG (Fair Value Gap):
The yellow box around 1.3820–1.3830 is a fair value gap where price is expected to retrace before continuing upward.
Acts as a short-term demand zone.
2. MSS (Market Structure Shift):
The chart marks a bullish MSS, meaning structure has flipped from bearish to bullish.
Confirms upside continuation bias.
3. EMA 200 (Dynamic Support):
EMA 200 sits around 1.3797, below current price.
Reinforces the bullish bias as long as price stays above it.
4. Target Point:
Upside target is 1.3925, which aligns with previous highs / liquidity zone.
Chart suggests accumulation → retrace → bullish expansion into that level.
---
Trade Idea Summary:
Bias: Bullish
Scenario:
1. Price may retrace into the FVG zone (1.3820–1.3830).
2. Find support there and bounce.
3. Continue higher toward 1.3925 target point.
Entry Idea: Buy near the FVG demand zone (with bullish confirmation).
Target: 1.3925
Stop-Loss: Below the EMA / FVG (~1.3790).
Mr SMC Trading point
---
Conclusion:
This setup favors buying dips into the FVG zone as long as price respects the EMA 200. The target is 1.3925, making this a bullish continuation play after the recent market structure shift.
---
Please support boost 🚀 this analysis
Technical analysis of USD/CAD in the 4H timeframe. Here’s the behind the analysis:
---
Key Technical Points:
1. FVG (Fair Value Gap):
The yellow box around 1.3820–1.3830 is a fair value gap where price is expected to retrace before continuing upward.
Acts as a short-term demand zone.
2. MSS (Market Structure Shift):
The chart marks a bullish MSS, meaning structure has flipped from bearish to bullish.
Confirms upside continuation bias.
3. EMA 200 (Dynamic Support):
EMA 200 sits around 1.3797, below current price.
Reinforces the bullish bias as long as price stays above it.
4. Target Point:
Upside target is 1.3925, which aligns with previous highs / liquidity zone.
Chart suggests accumulation → retrace → bullish expansion into that level.
---
Trade Idea Summary:
Bias: Bullish
Scenario:
1. Price may retrace into the FVG zone (1.3820–1.3830).
2. Find support there and bounce.
3. Continue higher toward 1.3925 target point.
Entry Idea: Buy near the FVG demand zone (with bullish confirmation).
Target: 1.3925
Stop-Loss: Below the EMA / FVG (~1.3790).
Mr SMC Trading point
---
Conclusion:
This setup favors buying dips into the FVG zone as long as price respects the EMA 200. The target is 1.3925, making this a bullish continuation play after the recent market structure shift.
---
Please support boost 🚀 this analysis

(Services:✔️ JOIN Telegram channel
t.me/+zmgnHqUTiY8wMTU0
t.me/+zmgnHqUTiY8wMTU0
t.me/+zmgnHqUTiY8wMTU0
Join my recommended broker , link 👇
World best broker exness ✅D
one.exnesstrack.org/a/l1t1rf3p6v
t.me/+zmgnHqUTiY8wMTU0
t.me/+zmgnHqUTiY8wMTU0
t.me/+zmgnHqUTiY8wMTU0
Join my recommended broker , link 👇
World best broker exness ✅D
one.exnesstrack.org/a/l1t1rf3p6v
Haftungsausschluss
Die Informationen und Veröffentlichungen sind nicht als Finanz-, Anlage-, Handels- oder andere Arten von Ratschlägen oder Empfehlungen gedacht, die von TradingView bereitgestellt oder gebilligt werden, und stellen diese nicht dar. Lesen Sie mehr in den Nutzungsbedingungen.
(Services:✔️ JOIN Telegram channel
t.me/+zmgnHqUTiY8wMTU0
t.me/+zmgnHqUTiY8wMTU0
t.me/+zmgnHqUTiY8wMTU0
Join my recommended broker , link 👇
World best broker exness ✅D
one.exnesstrack.org/a/l1t1rf3p6v
t.me/+zmgnHqUTiY8wMTU0
t.me/+zmgnHqUTiY8wMTU0
t.me/+zmgnHqUTiY8wMTU0
Join my recommended broker , link 👇
World best broker exness ✅D
one.exnesstrack.org/a/l1t1rf3p6v
Haftungsausschluss
Die Informationen und Veröffentlichungen sind nicht als Finanz-, Anlage-, Handels- oder andere Arten von Ratschlägen oder Empfehlungen gedacht, die von TradingView bereitgestellt oder gebilligt werden, und stellen diese nicht dar. Lesen Sie mehr in den Nutzungsbedingungen.